Assessment Experience Increases WIOA Performance in the City of Los Angeles YouthSource Program: A Replication
Mark L. Perkins, John E. Reeves, Deborah K. Furlong
Abstract
The Workforce Innovation and Opportunity Act (WIOA) measures labor market outcomes as indicators of program performance. This article examines assessment program impact on the rate of performance on key outcome measures and associated gains across program years 14-15 and 15-16 in the City of Los Angeles YouthSource Program. As found in Perkins et al. (2016), the InnerSight Assessment Experience has a positive impact on youth performance on WIOA outcome measures. In addition, significant changes across program years and gains in performance were identified.
The City of Los Angeles Economic Workforce Development Department (EWDD) offers the InnerSight Assessment Experience as a consistent program element across its 13 YouthSource service sites. This study replicates a 2016 study identifying the significant impact of this common program element on youth development as indicated by performance on Workforce Innovation and Opportunity Act (WIOA) outcome measures of Literacy, Placement, and Attainment (United States Department of Labor, Employment and Training Administration (2015)). This study determines if the evidence for assessment program impact continues, and examines if there are significant between year gains.
Background
The City of Los Angeles YouthSource program is a premier provider of service for in and out-of-school youth. The City serves some 17,000 youth in its annual and summer programs. The Los Angeles YouthSource program has been nationally acclaimed by the Department of Labor for its progressive commitment to serving out-of-school youth. In 2012, before the new WIOA service requirements, the City made a substantial commitment to serving this population when it required that 70% of the youth served at its 13 YouthSource sites be out-of-school youth. As a result, YouthSource has become the nation’s most successful program in addressing the needs of this underserved population.
YouthSource program leadership desired to offer a consistent program element to serve youth across its 13 sites. They wanted a program element that is developmental for each participant while meeting WIOA expectations and requirements. Specifically, they were seeking a program that would accomplish the following:
- Actively engage participants in the development of their individual plan.
- Provide caseworkers with a foundation for development of individual plans grounded in participant’s assessment results.
- Connect individual plans and strategies to specific educational, training and occupational goals.
- Help caseworkers and clients see those skills needed to achieve occupational fit.
- Provide documentation of participant and case manager mutual engagement and results oriented planning.
They believe a program grounded in participant personal development that connects youth with high demand occupations facilitates persistence in the attainment of educational, training and career goals. The City selected the InnerSight Assessment Experience to accomplish this important program objective. In 2016, Perkins et al. found those who had the InnerSight Experience in the YouthSource program significantly outperformed the youth who did not have the experience on WIOA Literacy and Attainment outcome measures. Based on this finding, YouthSource leadership wished to determine if this impact was replicable, and if there are significant gains across years.
The InnerSight Assessment Experience
The InnerSight Experience™ gives participants a vocabulary, context, and framework for bringing their personal interests and preferences to bear on life’s choices. This Experience puts the “Power of the Person” in the decision-making processes of life. Through the Experience, participants come to see they are the “Key” to their personal, educational, and career training choices and gain important information about themselves upon which to reflect when making those choices.
The InnerSight Assessment Experience consists of an online interest and preference inventory (The Strong Interest Inventory®) resulting in a personalized InSight Guide booklet which is the foundation for a 3-hour, formative, in-person, group interpretative experience. This interactive experience cognitively and psychologically engages participants in individual and group exercises that emphasize and highlight the distinctiveness of their personal results. By self-validating their personal interests and preferences for working, learning, leading, risk-taking, and team orientation, participants are equipped to explore occupations of people who are satisfied in various occupations and share the participants’ interests.
When interests and preferences are aligned with an occupation (work tasks), satisfaction, happiness, and superior performance occur. Youth or adults with cultural, familial, and economic barriers are no exception. When engaged in subjects of interest (music, dance, skateboarding, etc.), individuals succeed.
The InnerSight Experience is grounded in the prolific research and universally acclaimed Work Types Model of the eminent vocational psychologist Dr. John Holland. The Holland Model was adopted by the Department of Labor as the foundation for their online career exploration system O*NET (O*NET OnLine. Retrieved from: https://www.onetonline.org/). This system can be directly accessed from the electronic Insight Guide booklet participants receive after completing the InnerSight Experience by simply clicking on a preferred occupation.
For over 90 years, interests and preferences have been known as key factors in motivation. Using interests and preferences to help individuals make better life choices is a time-tested and valid approach for assuring continued effort/success in education, career, and personal life.
InnerSight changed the traditional career assessment/exploration model. Youth are accustomed to being processed; that is, being asked what they know (education), or being told what they need to know and do next. InnerSight begins the journey by first exploring and having participants validate what they may like or enjoy doing. Additional exercises guide the participants to discover the connection between what they enjoy doing and potential occupations in which people who share their interests are satisfied.
The InnerSight Assessment Experience continues when participants meet with their case managers to begin Next Steps planning using the self-validated results in the InSight Guide booklet. Case managers who work with the youth complete the InnerSight Experience and training in “Facilitating the Journey.” “Facilitating the Journey” training provides case managers with the skills needed to engage the participant in a meaningful discussion of their results as the foundation for their individual service plan.
Each InnerSight Experience session is evaluated by the participants. Their ratings provide continuous feedback on characteristics of the Experience from the InSight Guide booklet to facilities and the accuracy of their results. In addition, they are asked to respond to three open-ended questions regarding what they liked, what they would change, and any additional thoughts they might have. These personal responses provide a rich source of qualitative information for understanding, in participants’ words, how they were impacted by the Experience.
The InnerSight Assessment Experience is designed to help WIOA staff align youth and adults with education, training programs, internships, and actual job openings that are a best fit for them. This approach has been empirically demonstrated to increase youth performance on WIOA outcome measures.
Literature
The literature is replete with studies and meta-analyses of workforce investment program performance. It has long been the interest of policymakers for job-training programs to be evaluated using tangible labor market results for participants. King (2004) notes the Department of Labor has funded a host of studies in recent decades to assess the impact of training programs using such measures.
Moore and Gorman (2004) observed; “Policymakers brought this focus on performance to the creation of the Workforce Investment Act (WIA) in 1998. WIA, which replaced the Job Training Partnership Act (JTPA), established 17 performance measures to drive program performance.” They go on to observe that most of the 17 metrics were for labor market outcome indicators, such as changes in participant earnings, rate at which participants are placed in jobs, etc.
Social Policy Research Associates (2004), in an early assessment of WIA implementation, noted that the 17 measures made sense to program operators but concluded that some operators felt definitions were vague and perhaps there were too many. As WIA evolved, the Federal Department of Labor elected to move to a new measurement system consisting of fewer labor market outcomes known as “common measures”. Dunham, Mack, Salzman and Wiegand (2006) note that these “common measures were to be implemented for adults beginning in Program Year (PY) 2005, which began July 1, 2005, and for youth in PY 2006 (beginning July 1, 2006)”. (pg.22)
While there is a plethora of publicly available performance data, Moore and Gorman (2004) observe “there is little in-depth analysis of the performance of the WIA system or of the likely drivers of the new common measures. Specifically, there has been little published on the relationship between individual participant characteristics and the program performance measures.” In fact, the Moore and Gorman study on the impact of training and demographics in WIA program performance is the first to be found examining how the characteristics of participants may or may not influence the outcomes measured.
Moore and Gorman (2004) identified the profound impact of demographics on WIA performance measures. They go further, suggesting “there is a need for researchers to undertake more nuanced studies of the connections between training and labor market outcomes in WIA, with carefully controlled studies to identify the types of participants and types of training most likely to lead to successful outcomes.” (p. 394) This suggests a need for providers to understand what program elements, assessments, or experiences have a positive impact on participants’ performance on the common WIA metrics.
Borden (2009), in a comprehensive article on the challenges of measuring employment program performance, states “research on employment and training programs focuses primarily on evaluations of the impact of public investment in job-training services”. (p. 2) He goes on to suggest that, in performance management, there is indeed a dichotomy between the program management performance objectives and program evaluative objectives. Moore and Gorman (2004) focused on the impact of demographic characteristics and their relationship to the achievement of performance measures.
Barnow and Smith (2004) clearly suggest that program evaluation and performance management derive from different sources and motives and have deeply committed adherents. The question is not whether we should track or measure program performance, but rather, how do program elements contribute to the achievement of job-training and employment program objectives? As suggested by Borden (2009), “there is an increasing tendency to leverage the efficiency of analyzing administrative data versus more expensive experimental designs”. (p. 5) The truth is both are needed, but the experimental designs with appropriate stratified samples of participants for randomization with clean and accurate participant data are not only more expensive, but practically impossible to achieve. Thus, impact studies with limitations may be the most informative indicators of positively contributing program elements for achieving job-training program results. Most importantly, as suggested by Borden, a good measure must produce a rate of success and not simply a count of activities.
Borden properly points out that “we must distinguish clearly between service delivery and program management. Performance management systems track common events such as enrollment date, customer characteristics, limited service dates, exit date, and outcomes. Performance management systems do not specify how services are delivered.” (p. 21) nor do they indicate how services impact performance management outcomes. While it is impossible to design measures that account for all factors bearing on the success with a single customer, focused impact studies can be helpful in determining a program or assessment’s potential accountability for or contribution to program outcomes. With clear program performance measures in place we can begin the analysis of those processes and methods that produce the best results for program participants.
The first major update in almost 15 years to the Workforce Investment Act of 1998 (WIA) was signed into law in 2014. The new federal Workforce Innovation and Opportunity Act (United States Department of Labor, Employment and Training Administration (2015)), places greater emphasis on serving out-of-school youth (75% versus 30% under WIA). WIOA defines out-of-school youth as 16 to 24-year-olds who are not attending any school and who have one or more barriers to employment, such as young people who are homeless, are parenting, have disabilities, or have a juvenile criminal record. The new law requires states and localities to develop strategies and programs for recruiting and serving more of these young people than ever before.
This could be a daunting task. Hossain (2015) observes that “while a majority of the out-of-school youth seek out opportunities to connect training and work, youth programs often report difficulties in sustaining participation after the initial connection is made. WIOA-funded service providers will not only have to reach more out-of-school youth, they will also need strategies to stimulate sustained, intense engagement in services.” (p. 1) Hossain goes on to observe that “few programs target the young people who are the most persistently disconnected, and there’s not much evidence on what works in engaging them.” (p. 3) Perhaps most importantly Hossain says that “a significant share of out-of-school youth do not enroll in education and training programs because they have been alienated from mainstream institutions, like schools and social welfare agencies, due to earlier negative experiences. New strategies to reach and engage alienated and disaffected young people should be a priority.” (p. 3)
Hossain suggests programs “have to find a balance between allowing vulnerable young adults some flexibility in regard to program requirements… while developing processes and practices that allow young people to develop autonomy and leadership” (p. 4). Specifically, Hossain recommends “asking young people for their input in designing program activities and allowing them to have a voice in program governance.” (p. 4)
WIOA encourages implementation of career pathway approaches that support post-secondary education and training for out-of-school youth that is related to the demand for qualified workers in local labor markets. The individualized pathway is to be grounded in an assessment of skills and interests that can inform the participants’ career decision-making while identifying logical short-term next steps consistent with long-range goals.
The US Departments of Education, Health and Human Services, and Labor issued a joint letter in 2012 that provided a common definition of career pathways that encompasses initiatives that begin with secondary or post-secondary education and credentials. According to the letter a career pathway approach is:
“…A series of connected education and training strategies and support services that enable individuals to secure industry relevant certification and obtain employment within an occupational area and to advance to higher levels of future education and employment in that area.”
Richard Kazis, in a MDRC research brief on Career Pathways (2016), observes “there is little rigorous research that assesses the impact of comprehensive career pathways programs that follows individuals from different starting points through a coherent set of educational experiences and “stackable” credentials to the labor market.” (p. 2) Kazis suggests there is a paucity of research on how to positively engage the participant in his/her personal development of a successful career pathway.
Research has primarily focused on program performance, yielding discussions on topics such as the importance of the employer network, career demand, and issues of program integration, curriculum and process. These focus on what is “done to” the participant and rarely on what is “done with them”. Except for Moore and Gorman (2004), who examined the impact of demographic characteristics on program performance measures, there was virtually no research examining the impact of program elements offered by providers on WIOA performance indicators.
Perkins et al. (2016) sought to understand if a single YouthSource program element, the Assessment Experience, has a positive impact on rates of success on WIOA performance indicators. The results provided evidence of significantly higher success rates on WIOA performance measures for those participating in the InnerSight Experience than for those who did not. These results lead to the desire to better understand how the Experience works from the participants’ perspective.
Perkins et al. (2017) examined the InnerSight Assessment Experience as a strategy for reaching and engaging alienated and disaffected young people as suggested by Hossain (2015). This qualitative study of 899 youth participants’ narrative evaluation statements suggests, as found by Dawes and Larson (2011), that youth engage when the activity is all about them. Putting the youth in the process using their assessment information in a formative assessment experience helps them connect. This can lead, as Rickman (2009) states, to “finding fit”. It was found that the Assessment Experience unleashed the power of personal connection and motivation.
This study replicates Perkins et al. (2016) analysis of a robust population of WIOA participants from a large, diverse city exploring the relationship between the participants’ program assessment experiences and subsequent performance on WIOA common measures. In addition, it seeks to identify any significant gains in performance across project years.
Impact Analysis Approach
As noted by Moore and Gorman (2004) and Borden (2009), the gold standard random-assignment experimental design is extremely difficult and virtually cost prohibitive to use with live WIOA programs. This is perhaps why there is virtually no research on the impact of individual program elements on the common WIOA performance measures. As a result, program providers are left with little or no information regarding program elements that significantly impact participant performance on program performance indicators.
While this study, like Perkins et al. (2016), could be referred to as a quasi-experimental design, the authors prefer to call it an impact analysis. This is an effort to learn if there is a consistent impact of an assessment experience on participant’s achievement on WIOA outcome measures. Essentially, it will be helpful to know if the assessment experience continues to significantly impact youth performance on program outcome measures as well as if there are any significant gains in performance.
Method
Research Questions: This study analyzes youth participant performance on WIOA outcome measures for youth participating in the City of Los Angeles YouthSource program in 2015–16 and compares that performance with performance in 2014-15 to address the following questions:
- Do youth participants who have the InnerSight Assessment Experience achieve satisfactory performance on the WIOA outcome measures of Attainment, Literacy and Placement at a significantly greater rate than those who have not had the Experience?
- Do out-of-school youth participants who have the InnerSight Assessment Experience achieve satisfactory performance on the WIOA outcome measures of Attainment, Literacy and Placement at a significantly greater rate than out-of-school youth who do not have the Experience?
- Does the impact of the InnerSight Assessment Experience on WIOA outcome measures of Attainment, Literacy and Placement grow between program years 14-15 and 15-16?
- Are gains between years in performance for InnerSight Assessment Experience participants significantly larger than those for the control group on the WIOA outcome measures?
Study Population: The study population consists of in-school and out-of-school youth participating in the City of Los Angeles YouthSource program at one of 13 provider sites across the City. Study participants are youth the City of Los Angeles included in the performance analysis for each of three WIOA performance outcome criteria for program years 2014–15 and 2015-16. Performance of youth participants who have completed the InnerSight Assessment Experience (Experimental Group) is compared with those who did not complete the Experience (Control Group). The outcome performance measures for this study were drawn from the City of Los Angeles “Jobs LA” performance tracking system. The outcome measures for this study are described below.
Literacy– Literacy & Numeracy Gains
This indicator measures the increase by one or more educational functioning levels from out-of-school youth who are basic skills deficient within a one-year period of participating in program services.
Meeting the Standard: Youth meet the outcome standard for this measure if they:
- Show increase in skills as measured by the Comprehensive Adult Student Assessment System (CASAS) Life & Work (reading) and Life Skills (math) Series at program entry within one year of start of program services.
- Increase one educational function level (EFL) in math, reading or both, during each year of program participation.
Placement -Placement in Employment, Education, or Training
This indicator measures whether a participant is in an education or training program that leads to a recognized post-secondary credential or unsubsidized employment in 1st Quarter after program exit. This measure requires a quarterly follow up for one year after program exit.
Meeting the Standard: Youth meet the outcome standard for this measure if they meet one of the following:
- Employed by an unsubsidized organization.
- Entered military service.
- Enrolled in a post-secondary education program.
- Enrolled in an advanced training or occupational skills training program.
Attainment -Credential Rate
This indicator measures the attainment of a high school diploma, GED, or certificate during program participation or by the end of the 1st Quarter after program exit.
Meeting the Standard: Youth meet the outcome standard for this measure if they meet one of the following:
- Receive a High School diploma certifying completion of a secondary school program of studies.
- Receive satisfactory scores on the General Education Development (GED) test.
- Receive a formal award certifying the satisfactory completion of an organized program of study at a post-secondary education program.
Program Year 2015-16 demographic information for the InnerSight Experience and Control groups can be found in Table 1. The average age for the three study groups ranges from 17.3 to 19.1 years. Comparable information for Program Year 2014-15 may be found in Perkins et al. (2016).
Since the cohort deemed appropriate for each individual outcome is different, it is helpful to know participant distribution by outcome cohort. The 2015-16 study participant distribution by outcome measure cohort is provided below.
Literacy: The Literacy outcome measure is used for out-of-school youth only. Of the total 1,727 Literacy participants, 682 (39%) completed the InnerSight Assessment Experience while 1,045 (61%) did not have the Experience.
Placement: The Placement outcome measure was deemed appropriate for a total of 2,353 youth participants of which 603 were in-school-youth (26%) and 1,750 were out-of-school youth (74%). A total of 793 participants completed the InnerSight Assessment Experience (34%) while 1,560 in the control group did not have the Experience (66%).
Of the in-school youth, 256 or 42% completed the InnerSight Assessment Experience while 347 or 58% in the control group did not. Of the out-of-school youth participants for this measure, 537 or 31% completed the InnerSight Experience while 1,213 or 69% in the control group did not.
Attainment: The Attainment outcome measure was deemed appropriate for a total of 1,691 youth participants of which 624 were in-school-youth (37%) and 1067 were out-of-school youth (63%). A total of 624 participants completed the InnerSight assessment experience (37%) while 1067 (63%) in the control group did not have the Experience.
Of the in-school youth, 260 or 42% completed the InnerSight Assessment Experience while 364 or 58% in the control group did not. Of the out-of-school youth participants for this measure 364 or 34% completed the InnerSight Experience while 703 or 66% in the control group did not.
Table 1Participant Demographic Informationby InnerSight Experience and Control Group2015-16
|
Participant Groups |
Literacy Assessmenta |
Placement Assessment |
Attainment Assessment |
|||
|
N |
Average Age |
N |
Average Age |
N |
Average Age |
|
|
Overall |
1,727 |
19.0 |
2,353 |
18.6 |
1691 |
18.4 |
|
InnerSight |
682 |
18.9 |
793 |
18.4 |
624 |
18.3 |
|
Control |
1,045 |
19.1 |
1,560 |
18.7 |
1,067 |
18.4 |
|
In-school youth: |
||||||
|
InnerSight |
NA |
256 |
17.3 |
260 |
17.3 |
|
|
Control |
NA |
347 |
17.4 |
364 |
17.5 |
|
|
Out-of-school youth: |
||||||
|
InnerSight |
682 |
18.9 |
537 |
19.0 |
364 |
19.0 |
|
Control |
1,045 |
19.1 |
1,213 |
19.0 |
703 |
19.0 |
| a -All participants on Literacy Outcome measure are Out-of-School Youth. | ||||||
Information for gender and ethnicity of participants was not available in the data extract provided by the City of Los Angeles from the “Jobs LA” performance tracking system. However, the City of Los Angeles did provide total program gender and ethnicity information for program year 2015-16 reflecting a robust and diverse population of participating youth. For 2015-16, there were 1,947 females (54.4%) and 1,630 males (45.6%). The reported ethnic makeup, as expected, is very diverse with the largest reporting group being Hispanic or Latino followed by White and African American/Black. The mix of Race or Ethnicity in the population is so large that participants are permitted to select more than one race or ethnicity suggesting that the standard race identification categories are rapidly becoming ineffective demographic descriptors or study variables for this population.
Analysis: As Borden (2009) suggests, a good measure must produce a rate of success and not simply a count of activities. Therefore, the rate of success on each of the WIOA outcome measures (Literacy, Placement and Attainment) will be calculated for participants appropriate for assessment on each measure as an indicator of program performance. To assess the impact of the InnerSight Assessment Experience, the percent succeeding on each measure is compared for those who had the InnerSight Assessment Experience with those who did not have the Experience (control group). Differences in rate of performance will be analyzed using chi-square to determine if they are significant or if they occurred by chance alone.
Testing the significance of gains associated with the InnerSight Experience between 2014-15 and 2015-16 will use analysis of variance to examine the difference between the Control group and InnerSight group; the difference in performance between the first year and the second-year participants; and for the interaction. The interaction measures whether the gains, if any, for the InnerSight populations between the first and second year are statistically larger than the gains, if any, experienced by the Control groups. A significant interaction will identify if programs and case managers become more effective with the InnerSight Assessment Experience outcomes across time.
Results
The performance rates of participating youth successfully meeting the performance standard for program year 2015-16 are provided in Table 2 for each of the three outcome measures. The overall rate of successful performance is 75% for Placement, 60% for Attainment and 56% for Literacy. Table 2 reveals considerable variance in performance rates between in-school youth and out-of-school youth as well as between those who have had the InnerSight Assessment Experience and those who have not on the Placement and Attainment outcomes. Performance rate comparisons and examination of significant differences are provided below by WIOA outcome measure.
Table 2Rate of Successful Performance 2015-16:Percent of Participating Youth Achieving Outcome Measure
|
Literacy Outcome1 |
Placement Outcome |
Attainment Outcome |
|
|
All Participants |
56% |
75% |
60% |
|
InnerSight |
57% |
81% |
74% |
|
Control |
56% |
71% |
52% |
|
In-school youth: |
80% |
81% |
|
|
InnerSight |
– |
88% |
94% |
|
Control |
– |
74% |
71% |
|
Out-of-School youth: |
56% |
73% |
48% |
|
InnerSight |
57% |
79% |
60% |
|
Control |
56% |
70% |
43% |
| 1All participants on Literacy Outcome measure are Out-of-School Youth. |
|||
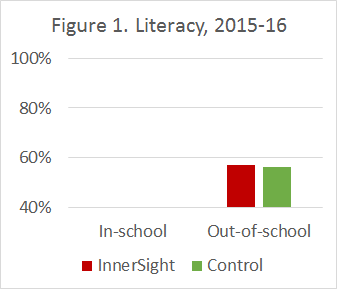
Literacy: Only out-of-school youth participate in the Literacy outcome measure. For the 2015-16 program year population, 56% met the standard. Those who had The InnerSight Assessment Experience had a 57% success rate while those who did not have the InnerSight Experience achieved a 56% success rate (see Figure 1). The 1% difference in performance rate for those completing the InnerSight Experience is not statistically significant (X2(1, N=1,727)=0.504, p=.478). InnerSight Assessment Experience participants are no more likely than other participants to achieve the Literacy standard. This result is different from program year 2014-2015 findings in which InnerSight participants significantly outperformed the control group by 6% (X2(1, N=1,665)=3.99, p=.046).
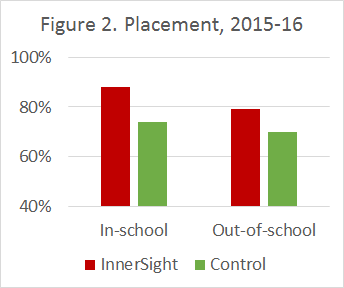
Placement: For the 2015-16 program year, 75% successfully met the Placement outcome measure standard as can be seen in Table 2. The performance measure success rate for those who had the InnerSight Assessment Experience was 81% while the success rate for those who did not have the Experience was 71%. This suggests that those who have the InnerSight Experience are more likely to achieve success on the Placement outcome performance measure than those who do not. The 10% difference in performance rate for InnerSight Experience participants was statistically significant, yielding a χ2 value of 20.5, with 1df, N=2,353 and a probability of p = .000. This finding is different from the 2014-15 program year study in which no difference was found on this measure for any category.
The impact of the InnerSight Assessment Experience on the Placement outcome differs dramatically for in-school and out-of-school youth (see Figure 2). The success rate of 88% for in-school youth on the Placement measure who had the InnerSight Experience was a statistically significant 14% greater than the 74% success rate for in-school youth who did not have the Experience. The statistical analysis yielded a χ2 value of 16.5 with 1df and an N=603 with a probability of p = .000.
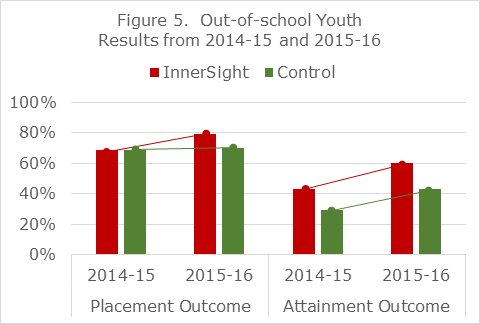
Examination of the success rates for the WIOA critical population of out-of-school youth shows that those who complete the InnerSight Assessment Experience are significantly more likely than their peers to achieve success on the Placement performance measure. The success rate on the Placement outcome measure for those having the InnerSight Experience is 79% versus 70% for those who do not. This 9% difference in performance rate is statistically significant yielding a χ2 value of 12.9 with 1df, an N of 1,750 and a probability of p = .000.
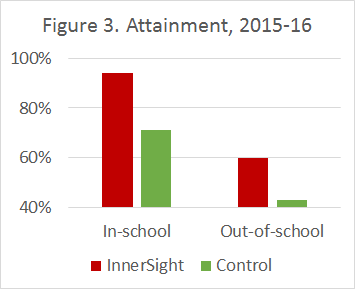
Attainment: For the 2015-16 program year, 60% successfully met the Attainment outcome measure standard as can be seen in Table 2. The performance measure success rate for those who had the InnerSight Experience was 74% while the success rate for those who did not have the Experience was 52%. This suggests that those who have the InnerSight Assessment Experience are more likely to achieve success on the Attainment outcome performance measure than those who do not. The 22% difference in performance rate for InnerSight Experience participants was statistically significant, yielding a χ2 value of 78.3, with 1df, N=1,691 and a probability of p = .000. This difference is 11% larger than the significant difference found for all participants in the 2014-15 program year study.
The impact of the InnerSight Assessment Experience on the Attainment outcome differs for both in-school and out-of-school youth (see Figure 3). The success rate of 94% for in-school youth on the Attainment measure who had the InnerSight Experience was significantly greater than the 71% success rate for in-school youth who did not have the Experience. The statistical analysis yielded a χ2 value of 51.1 with 1df and an N=624 with a probability of p = .000. This 23% difference is considerably larger than the statistically insignificant 6% measured in program year 2014-15.
Examination of the success rates for the WIOA critical population of out-of-school youth shows that those who complete the InnerSight Assessment Experience are significantly more likely than their peers to achieve success on the Attainment performance measure. The success rate on the Attainment outcome measure for those having the InnerSight Experience is 60% versus 43% for those who do not. This 17% difference in performance rate is statistically significant yielding a χ2 value of 28.9 with 1df, an N of 1,067 and a probability of p = .000. This difference is greater than the 14% difference in the 2014-15 program year, which was also statistically significant. What is most interesting, however, is the InnerSight Experience in 2015-16 levels the playing field for out-of-school youth who achieve a performance success rate equal to that of the overall population at 60%.
Research Question 1- the results show that youth who have the InnerSight Assessment Experience achieve successful performance on the Placement and Attainment performance measures at a significantly greater rate than those who do not have the Experience. With regard to the Literacy outcome measure, rate of performance is not impacted by the InnerSight Experience in the 2015-16 program year. The findings for Attainment were consistent and stronger for all groups over the 2014-15 program year. While Placement did not reveal any significant differences in 2014-15, the 2015-16 study found substantial significant differences across all participant levels.
Research Question 2- the results show a significant difference between the successful performance rate of out-of-school youth (WIOA’s primary target group) who have the InnerSight Assessment Experience and those who do not on the Attainment and Placement outcome measures in this study. Out-of-school youth who had the InnerSight Experience performed significantly better on the Attainment outcome measure (+17%) and on the Placement outcome measure (+9%) than those who did not have the Experience. The findings for Attainment were consistent and stronger for all groups over the 2014-15 program year. While Placement did not reveal any significant differences in 2014-15 program year, this study found significant differences in 2015-16 across all participant levels. The statistically significant impact of the Experience on the Literacy measure in 2014-15 was somewhat weak (a 6% difference) and was not affirmed in the 2015-16 replication. The InnerSight Experience is not designed to improve the kind of outcomes associated with the Literacy measure so this insignificant result is not surprising.
Analysis of Gain
Research question three seeks to understand if there are significant improvements in the impact of the InnerSight Experience between program years 2014-15 and 2015-16. Data identifying between-year changes in performance of InnerSight Assessment Participants on the Literacy, Placement and Attainment measures are provided in Table 3 (also see Appendix A for statistical results).
Table 3InnerSight Participant Performance Change Across Program Years2014-15 to 2015-16
|
InnerSight Participants |
Literacy1 14-15 15-16 Change |
Placement 14-15 15-16 Change |
Attainment 14-15 15-16 Change |
||||||
|
Total |
48% |
57% |
+9% |
69% |
81% |
+12% |
58% |
74% |
+16% |
|
In-school |
– |
– |
71% |
88% |
+17% |
85% |
94% |
+9% |
|
|
Out-of-school |
48% |
57% |
+9% |
69% |
79% |
+10% |
43% |
60% |
+17% |
| 1All participants on Literacy Outcome measure are Out-of-School Youth. | |||||||||
On the Literacy outcome, InnerSight participant performance increased by 9%, from 48% to 57%. This 9% change for InnerSight participants is statistically significant, yielding a χ2 value of 6.58 with 1df, an N of 682 and p=.010. Performance on the Literacy outcome is stronger for 2015-16 InnerSight participants than in the first year.
Gain in performance on the Placement outcome is 12% between 2014-15 and 2015-16 for InnerSight participants. This change in performance for the InnerSight participants on Placement is statistically significant, yielding a χ2 value of 21.07 with 1df, an N of 793 and p=.000.
Similar results are found when examining the change in performance for the in-school and out-of-school participants on Placement. For in-school youth, the InnerSight Assessment participant outcomes significantly increased 17% (χ2 value of 14.34 with 1df, an N of 256 and p=.000). For out-of-school youth, InnerSight participant outcomes significantly increased 10% (χ2 value of 9.33 with 1df, an N of 537 and p=.002).
On the Attainment outcome, InnerSight participants’ success rate increased by 16% between 2014-15 and 2015-16. This was a significant improvement (χ2 value of 24.98 with 1df, an N of 624 and p=.000). For in-school youth, InnerSight participants’ outcomes significantly increased 9% on Attainment (χ2 value of 8.99 with 1df, an N of 260 and p=.003). For out-of-school youth, InnerSight participant success significantly increased 17% (χ2 value of 14.91 with 1df, an N of 364 and p=.000).
Research Question 3- the results show that the impact of the InnerSight Assessment Experience on WIOA outcome measures of Attainment, Literacy and Placement grew significantly between program years 14-15 and 15-16, for all participants as well as for the in-school and out-of-school youth.
The final research question seeks to understand if gains between years in performance of InnerSight Assessment Experience participants are significantly larger than those for the control group on the WIOA outcome measures. Analysis of variance was used to determine if InnerSight participant gains are significantly larger than gains for the control group (see Appendix A, Note 1).
On the Literacy measure, both the InnerSight and Control groups improved, but the size of the improvement for each group is statistically equal. The 9% gain for InnerSight is statistically equal to the 14% gain for the Control group (F1,1726=3.095, ns). The gain experienced by InnerSight participants may have resulted from some systemic difference that affected both groups equally for the Literacy outcome.
On the Placement measure, the 11% difference in performance gains between the InnerSight participants and the control group was statistically significant (F1,2352=11.315, p=.001). For in-school youth the 16% difference was also significant (F1,602=7.140, p=.008), as was the 9% difference for out-of-school youth (F1,1749=4.804, p=.028). In all comparisons, the gains between 2014-15 and 2015-16 for InnerSight participants on the Placement outcome were significantly larger than those for the control group.
On Attainment, the 11% difference in performance gains between the InnerSight participants and the control group was statistically significant (F1,1690=7.732, p=.005) as was the 17% difference for the in-school youth (F1,623=11.636, p=.001). For the out-of-school youth, the 17% improvement by the InnerSight participants (from 43% to 60%) and the 14% improvement by the control group (from 29% to 43%) were large and statistically significant, but the 3% difference in these improvements is not significant (F1,1066=0.461, ns). As with the Literacy measure, the gains between 2014-15 and 2015-16 documented for research question three for the InnerSight participants may have been influenced by some systemic difference affecting all participants equally.
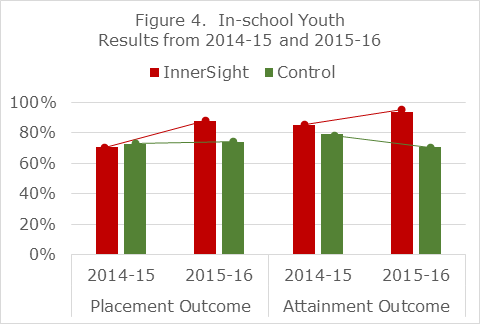
Figures 4 and 5 reflect changes in performance for in-school and out-of-school youth, respectively.
Research Question 4- the results show that except for one instance the performance gains for the InnerSight Assessment Participants on Placement and Attainment outcomes are significantly larger than those for the control group. No significant differences were identified on the Literacy outcome.
Discussion
The literature has offered virtually no research on program elements that impact youth success on WIOA performance outcomes. Existing research (Moore and Gorman, 2004) focused only on the impact of participant demographic characteristics on outcome measures. Borden (2009) noted that performance management systems do not specify how services are delivered and that measures of program performance must produce a rate of success and not simply a count of activities. The Perkins, et al. (2016) study responded to both concerns with a focus on the InnerSight Assessment Experience as a program element in service delivery and examined its impact on participant rate of performance on WIOA outcome measures.
The Perkins, et al. (2016) finding that out-of-school youth met the Attainment performance standard at a 14% greater rate if they have the InnerSight Assessment Experience (43%) than those who do not (29%) had both statistical and practical significance. It demonstrated that program elements influence participant performance on WIOA outcome measures. Results were similar on the Literacy outcome measure with a 6% significantly greater rate of performance for out-of-school youth who had the InnerSight Experience (48%) than those who did not (42%). The Placement outcome measure performance rate was not influenced by the InnerSight Experience.
This follow-up study reveals a continuing impact for the InnerSight Assessment Experience on the WIOA outcome of Attainment and establishes a similarly significant positive impact on Placement. The results on Literacy, while larger for the InnerSight Experience group than the control group, did not result in a significant difference between those two groups.
The analysis of gains across program years shows significant improvements for all groups across all outcome measures. What is interesting is that, while all groups improve across years, the gains by InnerSight Assessment Experience participants are significantly larger than those for the control group on Attainment and Placement in most comparisons. This suggests that effectiveness in working with InnerSight Experience outcomes may improve over time. Case managers in 2015-16 not only had more on the job experience using InnerSight outcomes with youth; they also participated in additional InnerSight professional development training. Regular professional development and reinforcement of the effective use of program materials may contribute to gains in outcomes.
Performance gains for the control group are worthy of note (See Note 2 Appendix A). YouthSource case managers participate in the InnerSight Facilitating the Journey professional development training and work with all participants. It is possible that case managers who work with the InnerSight tool begin to work differently, and more effectively, with their non-InnerSight participants.
Examination of this impact, while beyond the scope of this effort, would yield important insights regarding case manager development. It would similarly be interesting to examine performance results to determine if InnerSight participant results are influenced by program site.
The target population for this study was young people who are the most persistently disconnected. Perkins et al. (2017), found that the InnerSight Assessment Experience is an intensive interpretive program element that works by engaging youth. When case managers follow up using the InnerSight Experience outcomes to chart next steps to educational and occupational goals, the results are personally engaging, developmental, and productive. This is one of those new strategies Hossain (2015) suggests is needed and should be a priority in reaching and engaging alienated and disaffected young people.
Hossain recommends “asking young people for their input in designing program activities and allowing them to have a voice in program governance.” (p.4) The InnerSight Experience capitalizes on this by increasing the youth’s voice in the use of personalized assessment results in designing a personal pathway to success. This is particularly productive in establishing individualized short-term and long-term goals as required by WIOA in each youth’s Individual Service Plan.
Kazis (2016) suggests there is a paucity of research on how to positively engage the participant in his/her personal development of a successful career pathway. The findings of Perkins et al. (2016, 2017) along with this study respond to this concern suggesting effective use of personal assessment results is a powerful building block. Far too often, assessment is viewed as something we do to people, or for them, rather than with them. Thus, we lose the opportunity for meaningful engagement and personal exploration, sacrificing the power of personal validation. Such engagement takes time and some professional expertise with the assessment tool which often is not available in many WIOA programs as it was in this study. Case managers using the InnerSight Experience materials have learned to work with youth to discuss and plan together important educational and career next steps. Such collaborative work leads to the program impact and gains in performance outcomes found in this study.
Service program elements have a profound impact on WIOA performance outcomes. The City of Los Angeles YouthSource program has focused on positive youth development by establishing a common program element across the City. This consistent program effort produces significant WIOA results. These program accomplishments are realized by “Putting the Person in the Process”.
References
Barnow, B. S., and Smith, Jeffrey. “Performance Management of U.S. Job Training Programs: Lessons from the Job Training Partnership Act.” Public Finance and Management, vol. 4, no. 3, 2004, pp. 247-287.
Borden, William S., Nov. 2009 Mathematica Policy Research, The Challenges of Measuring Employment Program Performance, in a paper delivered at the 2009 conference What the European Social Fund Can Learn from the WIA Experience. Retrieved from http://www.umdcipe.org/conferences/WIAWashington/Papers/Borden-Challenges-of-Measuring_Employment_Program_Performance.pdf
Dawes, N.P., Larson, R. (2011), How Youth Get Engaged: Grounded-theory research on motivational development in organized youth programs. Developmental Psychology, Vol 47(1), Jan 2011, pp 259-269.
Dunham, K., Mack, M., Salzman, J., Wiegand, A., May 2006, Evaluation of the WIA Performance Measurement System – Final Report. Retrieved from https://wdr.doleta.gov/research/FullText_Documents/Evaluation%20of%20the%20WIA%20Performance%20Measurement%20System%20-%20Final%20Report.pdf
Hossain, Farhana (2015). Serving Out-of-School Youth Under the Workforce Innovation and Opportunity Act (2014). Retrieved from http://www.mdrc.org/publication/serving-out-school-youth-under-workforce-innovation-and-opportunity-act-2014
Kazis, Richard (2016). MDRC Research on Career Pathways. Retrieved from http://www.mdrc.org/publication/mdrc-research-career-pathways
King, C. T. (2004). The effectiveness of publicly financed training services: Implications for WIA and related programs. In C. J. O’Leary, R. A. Straits, & S. A. Wandner (Eds.), Job training policy in the United States. Kalamazoo, MI: W. E. Upjohn Institute for Employment Research.
Moore, R. W., Gorman, P. C., Blake, D. R., Phillips, G. M., Rossy, G., Cohen, E., Grimes, T., & Abad, M. (2004). Lessons from the past and new priorities: A multi-method evaluation of ETP. Sacramento, CA: California Employment Training Panel.
O*NET OnLine. Retrieved from: https://www.onetonline.org/
Perkins, M.L., Reeves, J.E., Furlong, D.K., Pazur, E.A. (2017), City of Los Angeles YouthSource Assessment Experience Increases WIOA Performance Through Youth Engagement. Retrieved from https://www.myinnersight.com
Perkins, M.L., Reeves, J.E., Mancheno-Smoak, L., Furlong, D.K. (2016), Assessment Program Impact on Successful WIOA Program Performance in the City of Los Angeles YouthSource Program. Retrieved from https://www.myinnersight.com/impact-study-v2/
Rickman, A. N. (2009). A challenge to the notion of youth passivity: Adolescents’ development of career direction through youth programs (Unpublished master’s equivalency paper). University of Illinois at Urbana–Champaign
Social Policy Research Associates. (2004). The Workforce Investment Act after Five Years: Results from the National Evaluation of the Implementation of WIA. Retrieved from https://www.doleta.gov/reports/searcheta/occ/papers/spr-wia_final_report.pdf
United States Department of Labor, Employment and Training Administration (2015). Retrieved from https://www.doleta.gov/performance/guidance/laws_regs.cfm
United States Departments of Education, Health and Human Services, and Labor, “Joint Career Pathways Letter,” April 4, 2012. Retrieved from http://www2.ed.gov/news/newsletters/ovaeconnection/2012/04122012.html.
Appendix A: Statistical NotesNote 1: Statistical Results for Between Year Changes and Gains
|
Literacy
|
Program Year
|
Chi Square
|
P value
|
Correlation
|
Change
|
Significance
|
|
| 14-15 | 15-16 | ||||||
|
Out-of-school Youth: |
43% |
56% |
63.09 |
0.000 |
0.136 |
13% |
Both InnerSight and Control groups improved equally (F=3.095, p=.079) |
|
InnerSight |
48% |
57% |
6.58 |
0.010 |
0.083 |
9% |
|
|
Control |
42% |
56% |
47.09 |
0.000 |
0.139 |
14% |
|
|
Placement
|
Program Year
|
Chi Square
|
P value
|
Correlation
|
Change
|
Significance
|
|
| 14-15 | 15-16 | ||||||
|
All Participants |
70% |
75% |
12.97 |
0.000 |
0.054 |
5% |
|
|
InnerSight |
69% |
81% |
21.07 |
0.000 |
0.135 |
12% |
The improvement for InnerSight participants is significantly greater (F=11.315, p=.001) |
|
Control |
70% |
71% |
0.64 |
0.424 |
0.014 |
1% |
|
|
In-school Youth |
73% |
80% |
8.38 |
0.004 |
0.085 |
7% |
Both In-school and Out-of-School groups improved equally (F=1.074, p=.300) |
|
Out-of-school Youth |
69% |
73% |
6.57 |
0.010 |
0.045 |
4% |
|
|
In-school Youth: |
73% |
80% |
The improvement for InnerSight participants is significantly greater (F=7.140, p=.008) |
||||
|
InnerSight |
71% |
88% |
14.34 |
0.000 |
0.198 |
17% |
|
|
Control |
73% |
74% |
0.14 |
0.706 |
0.013 |
1% |
|
|
Out-of-school Youth: |
69% |
73% |
The improvement for InnerSight participants is significantly greater (F=4.804, p=.028) |
||||
|
InnerSight |
69% |
79% |
9.33 |
0.002 |
0.109 |
10% |
|
|
Control |
69% |
70% |
0.65 |
0.420 |
0.016 |
1% |
|
|
Attainment
|
Program Year
|
Chi Square
|
P value
|
Correlation
|
Change
|
Significance
|
|
| 14-15 | 15-16 | ||||||
|
All Participants |
49% |
60% |
39.90 |
0.000 |
0.111 |
11% |
|
|
InnerSight |
58% |
74% |
24.98 |
0.000 |
0.164 |
16% |
The improvement for InnerSight participants is significantly greater (F=7.732, p=.005) |
|
Control |
47% |
52% |
6.04 |
0.014 |
0.051 |
5% |
|
|
In-school Youth |
80% |
81% |
0.04 |
0.850 |
0.005 |
1% |
The improvement for Out-of-school Youth is significantly greater (F=24.846, p=.000) |
|
Out-of-school Youth |
32% |
48% |
60.84 |
0.000 |
0.172 |
16% |
|
|
In-school Youth: |
80% |
81% |
The improvement for InnerSight participants is significantly greater (F=11.636, p=.001) |
||||
|
InnerSight |
85% |
94% |
8.99 |
0.003 |
0.156 |
9% |
|
|
Control |
79% |
71% |
7.13 |
0.008 |
-0.093 |
-8% |
|
|
Out-of-school Youth: |
32% |
48% |
Both InnerSight and Control groups improved equally (F=.461, p=.497) |
||||
|
InnerSight |
43% |
60% |
14.91 |
0.000 |
0.163 |
17% |
|
|
Control |
29% |
43% |
30.84 |
0.000 |
0.144 |
14% |
|
Note 2: Comparison of Difference inInnerSight and Control Group PerformancePY 2014-15 to PY 2015-16
|
Participants |
Literacy1 |
Placement |
Attainment |
||||||
|
PY 14-15 |
PY 15-16 |
Change |
PY 14-15 |
PY 15-16 |
Change |
PY 14-15 |
PY 15-16 |
Change |
|
|
All Participants |
|||||||||
|
InnerSight |
69% |
81% |
58% |
74% |
|||||
|
Control |
70% |
71% |
47% |
52% |
|||||
|
Difference between InnerSight and Control group |
-1% |
10% |
11%** |
11% |
22% |
11%** |
|||
|
In-school Youth: |
|||||||||
|
InnerSight |
71% |
88% |
85% |
94% |
|||||
|
Control |
73% |
74% |
79% |
71% |
|||||
|
Difference between InnerSight and Control group |
-2% |
14% |
16%** |
6% |
23% |
17%** |
|||
|
Out-of-school Youth: |
|||||||||
|
InnerSight |
48% |
57% |
69% |
79% |
43% |
60% |
|||
|
Control |
42% |
56% |
69% |
70% |
29% |
43% |
|||
|
Difference between InnerSight and Control group |
6% |
1% |
-5% |
0% |
9% |
9%* |
14% |
17% |
3% |
| 1All participants on Literacy Outcome measure are Out-of-School Youth. | |||||||||
| *Difference is statistically significant at .05 | |||||||||
| ** Difference is statistically significant at .01 | |||||||||