Author Archives: cvboucher
InnerSight Deep Dive Podcast
Protected: IMS Coordinator User Guide
Assessment Experience Increases WIOA Performance in the City of Los Angeles YouthSource Program: A Replication
Mark L. Perkins, John E. Reeves, Deborah K. Furlong
Abstract
The Workforce Innovation and Opportunity Act (WIOA) measures labor market outcomes as indicators of program performance. This article examines assessment program impact on the rate of performance on key outcome measures and associated gains across program years 14-15 and 15-16 in the City of Los Angeles YouthSource Program. As found in Perkins et al. (2016), the InnerSight Assessment Experience has a positive impact on youth performance on WIOA outcome measures. In addition, significant changes across program years and gains in performance were identified.
The City of Los Angeles Economic Workforce Development Department (EWDD) offers the InnerSight Assessment Experience as a consistent program element across its 13 YouthSource service sites. This study replicates a 2016 study identifying the significant impact of this common program element on youth development as indicated by performance on Workforce Innovation and Opportunity Act (WIOA) outcome measures of Literacy, Placement, and Attainment (United States Department of Labor, Employment and Training Administration (2015)). This study determines if the evidence for assessment program impact continues, and examines if there are significant between year gains.
Background
The City of Los Angeles YouthSource program is a premier provider of service for in and out-of-school youth. The City serves some 17,000 youth in its annual and summer programs. The Los Angeles YouthSource program has been nationally acclaimed by the Department of Labor for its progressive commitment to serving out-of-school youth. In 2012, before the new WIOA service requirements, the City made a substantial commitment to serving this population when it required that 70% of the youth served at its 13 YouthSource sites be out-of-school youth. As a result, YouthSource has become the nation’s most successful program in addressing the needs of this underserved population.
YouthSource program leadership desired to offer a consistent program element to serve youth across its 13 sites. They wanted a program element that is developmental for each participant while meeting WIOA expectations and requirements. Specifically, they were seeking a program that would accomplish the following:
- Actively engage participants in the development of their individual plan.
- Provide caseworkers with a foundation for development of individual plans grounded in participant’s assessment results.
- Connect individual plans and strategies to specific educational, training and occupational goals.
- Help caseworkers and clients see those skills needed to achieve occupational fit.
- Provide documentation of participant and case manager mutual engagement and results oriented planning.
They believe a program grounded in participant personal development that connects youth with high demand occupations facilitates persistence in the attainment of educational, training and career goals. The City selected the InnerSight Assessment Experience to accomplish this important program objective. In 2016, Perkins et al. found those who had the InnerSight Experience in the YouthSource program significantly outperformed the youth who did not have the experience on WIOA Literacy and Attainment outcome measures. Based on this finding, YouthSource leadership wished to determine if this impact was replicable, and if there are significant gains across years.
The InnerSight Assessment Experience
The InnerSight Experience™ gives participants a vocabulary, context, and framework for bringing their personal interests and preferences to bear on life’s choices. This Experience puts the “Power of the Person” in the decision-making processes of life. Through the Experience, participants come to see they are the “Key” to their personal, educational, and career training choices and gain important information about themselves upon which to reflect when making those choices.
The InnerSight Assessment Experience consists of an online interest and preference inventory (The Strong Interest Inventory®) resulting in a personalized InSight Guide booklet which is the foundation for a 3-hour, formative, in-person, group interpretative experience. This interactive experience cognitively and psychologically engages participants in individual and group exercises that emphasize and highlight the distinctiveness of their personal results. By self-validating their personal interests and preferences for working, learning, leading, risk-taking, and team orientation, participants are equipped to explore occupations of people who are satisfied in various occupations and share the participants’ interests.
When interests and preferences are aligned with an occupation (work tasks), satisfaction, happiness, and superior performance occur. Youth or adults with cultural, familial, and economic barriers are no exception. When engaged in subjects of interest (music, dance, skateboarding, etc.), individuals succeed.
The InnerSight Experience is grounded in the prolific research and universally acclaimed Work Types Model of the eminent vocational psychologist Dr. John Holland. The Holland Model was adopted by the Department of Labor as the foundation for their online career exploration system O*NET (O*NET OnLine. Retrieved from: https://www.onetonline.org/). This system can be directly accessed from the electronic Insight Guide booklet participants receive after completing the InnerSight Experience by simply clicking on a preferred occupation.
For over 90 years, interests and preferences have been known as key factors in motivation. Using interests and preferences to help individuals make better life choices is a time-tested and valid approach for assuring continued effort/success in education, career, and personal life.
InnerSight changed the traditional career assessment/exploration model. Youth are accustomed to being processed; that is, being asked what they know (education), or being told what they need to know and do next. InnerSight begins the journey by first exploring and having participants validate what they may like or enjoy doing. Additional exercises guide the participants to discover the connection between what they enjoy doing and potential occupations in which people who share their interests are satisfied.
The InnerSight Assessment Experience continues when participants meet with their case managers to begin Next Steps planning using the self-validated results in the InSight Guide booklet. Case managers who work with the youth complete the InnerSight Experience and training in “Facilitating the Journey.” “Facilitating the Journey” training provides case managers with the skills needed to engage the participant in a meaningful discussion of their results as the foundation for their individual service plan.
Each InnerSight Experience session is evaluated by the participants. Their ratings provide continuous feedback on characteristics of the Experience from the InSight Guide booklet to facilities and the accuracy of their results. In addition, they are asked to respond to three open-ended questions regarding what they liked, what they would change, and any additional thoughts they might have. These personal responses provide a rich source of qualitative information for understanding, in participants’ words, how they were impacted by the Experience.
The InnerSight Assessment Experience is designed to help WIOA staff align youth and adults with education, training programs, internships, and actual job openings that are a best fit for them. This approach has been empirically demonstrated to increase youth performance on WIOA outcome measures.
Literature
The literature is replete with studies and meta-analyses of workforce investment program performance. It has long been the interest of policymakers for job-training programs to be evaluated using tangible labor market results for participants. King (2004) notes the Department of Labor has funded a host of studies in recent decades to assess the impact of training programs using such measures.
Moore and Gorman (2004) observed; “Policymakers brought this focus on performance to the creation of the Workforce Investment Act (WIA) in 1998. WIA, which replaced the Job Training Partnership Act (JTPA), established 17 performance measures to drive program performance.” They go on to observe that most of the 17 metrics were for labor market outcome indicators, such as changes in participant earnings, rate at which participants are placed in jobs, etc.
Social Policy Research Associates (2004), in an early assessment of WIA implementation, noted that the 17 measures made sense to program operators but concluded that some operators felt definitions were vague and perhaps there were too many. As WIA evolved, the Federal Department of Labor elected to move to a new measurement system consisting of fewer labor market outcomes known as “common measures”. Dunham, Mack, Salzman and Wiegand (2006) note that these “common measures were to be implemented for adults beginning in Program Year (PY) 2005, which began July 1, 2005, and for youth in PY 2006 (beginning July 1, 2006)”. (pg.22)
While there is a plethora of publicly available performance data, Moore and Gorman (2004) observe “there is little in-depth analysis of the performance of the WIA system or of the likely drivers of the new common measures. Specifically, there has been little published on the relationship between individual participant characteristics and the program performance measures.” In fact, the Moore and Gorman study on the impact of training and demographics in WIA program performance is the first to be found examining how the characteristics of participants may or may not influence the outcomes measured.
Moore and Gorman (2004) identified the profound impact of demographics on WIA performance measures. They go further, suggesting “there is a need for researchers to undertake more nuanced studies of the connections between training and labor market outcomes in WIA, with carefully controlled studies to identify the types of participants and types of training most likely to lead to successful outcomes.” (p. 394) This suggests a need for providers to understand what program elements, assessments, or experiences have a positive impact on participants’ performance on the common WIA metrics.
Borden (2009), in a comprehensive article on the challenges of measuring employment program performance, states “research on employment and training programs focuses primarily on evaluations of the impact of public investment in job-training services”. (p. 2) He goes on to suggest that, in performance management, there is indeed a dichotomy between the program management performance objectives and program evaluative objectives. Moore and Gorman (2004) focused on the impact of demographic characteristics and their relationship to the achievement of performance measures.
Barnow and Smith (2004) clearly suggest that program evaluation and performance management derive from different sources and motives and have deeply committed adherents. The question is not whether we should track or measure program performance, but rather, how do program elements contribute to the achievement of job-training and employment program objectives? As suggested by Borden (2009), “there is an increasing tendency to leverage the efficiency of analyzing administrative data versus more expensive experimental designs”. (p. 5) The truth is both are needed, but the experimental designs with appropriate stratified samples of participants for randomization with clean and accurate participant data are not only more expensive, but practically impossible to achieve. Thus, impact studies with limitations may be the most informative indicators of positively contributing program elements for achieving job-training program results. Most importantly, as suggested by Borden, a good measure must produce a rate of success and not simply a count of activities.
Borden properly points out that “we must distinguish clearly between service delivery and program management. Performance management systems track common events such as enrollment date, customer characteristics, limited service dates, exit date, and outcomes. Performance management systems do not specify how services are delivered.” (p. 21) nor do they indicate how services impact performance management outcomes. While it is impossible to design measures that account for all factors bearing on the success with a single customer, focused impact studies can be helpful in determining a program or assessment’s potential accountability for or contribution to program outcomes. With clear program performance measures in place we can begin the analysis of those processes and methods that produce the best results for program participants.
The first major update in almost 15 years to the Workforce Investment Act of 1998 (WIA) was signed into law in 2014. The new federal Workforce Innovation and Opportunity Act (United States Department of Labor, Employment and Training Administration (2015)), places greater emphasis on serving out-of-school youth (75% versus 30% under WIA). WIOA defines out-of-school youth as 16 to 24-year-olds who are not attending any school and who have one or more barriers to employment, such as young people who are homeless, are parenting, have disabilities, or have a juvenile criminal record. The new law requires states and localities to develop strategies and programs for recruiting and serving more of these young people than ever before.
This could be a daunting task. Hossain (2015) observes that “while a majority of the out-of-school youth seek out opportunities to connect training and work, youth programs often report difficulties in sustaining participation after the initial connection is made. WIOA-funded service providers will not only have to reach more out-of-school youth, they will also need strategies to stimulate sustained, intense engagement in services.” (p. 1) Hossain goes on to observe that “few programs target the young people who are the most persistently disconnected, and there’s not much evidence on what works in engaging them.” (p. 3) Perhaps most importantly Hossain says that “a significant share of out-of-school youth do not enroll in education and training programs because they have been alienated from mainstream institutions, like schools and social welfare agencies, due to earlier negative experiences. New strategies to reach and engage alienated and disaffected young people should be a priority.” (p. 3)
Hossain suggests programs “have to find a balance between allowing vulnerable young adults some flexibility in regard to program requirements… while developing processes and practices that allow young people to develop autonomy and leadership” (p. 4). Specifically, Hossain recommends “asking young people for their input in designing program activities and allowing them to have a voice in program governance.” (p. 4)
WIOA encourages implementation of career pathway approaches that support post-secondary education and training for out-of-school youth that is related to the demand for qualified workers in local labor markets. The individualized pathway is to be grounded in an assessment of skills and interests that can inform the participants’ career decision-making while identifying logical short-term next steps consistent with long-range goals.
The US Departments of Education, Health and Human Services, and Labor issued a joint letter in 2012 that provided a common definition of career pathways that encompasses initiatives that begin with secondary or post-secondary education and credentials. According to the letter a career pathway approach is:
“…A series of connected education and training strategies and support services that enable individuals to secure industry relevant certification and obtain employment within an occupational area and to advance to higher levels of future education and employment in that area.”
Richard Kazis, in a MDRC research brief on Career Pathways (2016), observes “there is little rigorous research that assesses the impact of comprehensive career pathways programs that follows individuals from different starting points through a coherent set of educational experiences and “stackable” credentials to the labor market.” (p. 2) Kazis suggests there is a paucity of research on how to positively engage the participant in his/her personal development of a successful career pathway.
Research has primarily focused on program performance, yielding discussions on topics such as the importance of the employer network, career demand, and issues of program integration, curriculum and process. These focus on what is “done to” the participant and rarely on what is “done with them”. Except for Moore and Gorman (2004), who examined the impact of demographic characteristics on program performance measures, there was virtually no research examining the impact of program elements offered by providers on WIOA performance indicators.
Perkins et al. (2016) sought to understand if a single YouthSource program element, the Assessment Experience, has a positive impact on rates of success on WIOA performance indicators. The results provided evidence of significantly higher success rates on WIOA performance measures for those participating in the InnerSight Experience than for those who did not. These results lead to the desire to better understand how the Experience works from the participants’ perspective.
Perkins et al. (2017) examined the InnerSight Assessment Experience as a strategy for reaching and engaging alienated and disaffected young people as suggested by Hossain (2015). This qualitative study of 899 youth participants’ narrative evaluation statements suggests, as found by Dawes and Larson (2011), that youth engage when the activity is all about them. Putting the youth in the process using their assessment information in a formative assessment experience helps them connect. This can lead, as Rickman (2009) states, to “finding fit”. It was found that the Assessment Experience unleashed the power of personal connection and motivation.
This study replicates Perkins et al. (2016) analysis of a robust population of WIOA participants from a large, diverse city exploring the relationship between the participants’ program assessment experiences and subsequent performance on WIOA common measures. In addition, it seeks to identify any significant gains in performance across project years.
Impact Analysis Approach
As noted by Moore and Gorman (2004) and Borden (2009), the gold standard random-assignment experimental design is extremely difficult and virtually cost prohibitive to use with live WIOA programs. This is perhaps why there is virtually no research on the impact of individual program elements on the common WIOA performance measures. As a result, program providers are left with little or no information regarding program elements that significantly impact participant performance on program performance indicators.
While this study, like Perkins et al. (2016), could be referred to as a quasi-experimental design, the authors prefer to call it an impact analysis. This is an effort to learn if there is a consistent impact of an assessment experience on participant’s achievement on WIOA outcome measures. Essentially, it will be helpful to know if the assessment experience continues to significantly impact youth performance on program outcome measures as well as if there are any significant gains in performance.
Method
Research Questions: This study analyzes youth participant performance on WIOA outcome measures for youth participating in the City of Los Angeles YouthSource program in 2015–16 and compares that performance with performance in 2014-15 to address the following questions:
- Do youth participants who have the InnerSight Assessment Experience achieve satisfactory performance on the WIOA outcome measures of Attainment, Literacy and Placement at a significantly greater rate than those who have not had the Experience?
- Do out-of-school youth participants who have the InnerSight Assessment Experience achieve satisfactory performance on the WIOA outcome measures of Attainment, Literacy and Placement at a significantly greater rate than out-of-school youth who do not have the Experience?
- Does the impact of the InnerSight Assessment Experience on WIOA outcome measures of Attainment, Literacy and Placement grow between program years 14-15 and 15-16?
- Are gains between years in performance for InnerSight Assessment Experience participants significantly larger than those for the control group on the WIOA outcome measures?
Study Population: The study population consists of in-school and out-of-school youth participating in the City of Los Angeles YouthSource program at one of 13 provider sites across the City. Study participants are youth the City of Los Angeles included in the performance analysis for each of three WIOA performance outcome criteria for program years 2014–15 and 2015-16. Performance of youth participants who have completed the InnerSight Assessment Experience (Experimental Group) is compared with those who did not complete the Experience (Control Group). The outcome performance measures for this study were drawn from the City of Los Angeles “Jobs LA” performance tracking system. The outcome measures for this study are described below.
Literacy– Literacy & Numeracy Gains
This indicator measures the increase by one or more educational functioning levels from out-of-school youth who are basic skills deficient within a one-year period of participating in program services.
Meeting the Standard: Youth meet the outcome standard for this measure if they:
- Show increase in skills as measured by the Comprehensive Adult Student Assessment System (CASAS) Life & Work (reading) and Life Skills (math) Series at program entry within one year of start of program services.
- Increase one educational function level (EFL) in math, reading or both, during each year of program participation.
Placement -Placement in Employment, Education, or Training
This indicator measures whether a participant is in an education or training program that leads to a recognized post-secondary credential or unsubsidized employment in 1st Quarter after program exit. This measure requires a quarterly follow up for one year after program exit.
Meeting the Standard: Youth meet the outcome standard for this measure if they meet one of the following:
- Employed by an unsubsidized organization.
- Entered military service.
- Enrolled in a post-secondary education program.
- Enrolled in an advanced training or occupational skills training program.
Attainment -Credential Rate
This indicator measures the attainment of a high school diploma, GED, or certificate during program participation or by the end of the 1st Quarter after program exit.
Meeting the Standard: Youth meet the outcome standard for this measure if they meet one of the following:
- Receive a High School diploma certifying completion of a secondary school program of studies.
- Receive satisfactory scores on the General Education Development (GED) test.
- Receive a formal award certifying the satisfactory completion of an organized program of study at a post-secondary education program.
Program Year 2015-16 demographic information for the InnerSight Experience and Control groups can be found in Table 1. The average age for the three study groups ranges from 17.3 to 19.1 years. Comparable information for Program Year 2014-15 may be found in Perkins et al. (2016).
Since the cohort deemed appropriate for each individual outcome is different, it is helpful to know participant distribution by outcome cohort. The 2015-16 study participant distribution by outcome measure cohort is provided below.
Literacy: The Literacy outcome measure is used for out-of-school youth only. Of the total 1,727 Literacy participants, 682 (39%) completed the InnerSight Assessment Experience while 1,045 (61%) did not have the Experience.
Placement: The Placement outcome measure was deemed appropriate for a total of 2,353 youth participants of which 603 were in-school-youth (26%) and 1,750 were out-of-school youth (74%). A total of 793 participants completed the InnerSight Assessment Experience (34%) while 1,560 in the control group did not have the Experience (66%).
Of the in-school youth, 256 or 42% completed the InnerSight Assessment Experience while 347 or 58% in the control group did not. Of the out-of-school youth participants for this measure, 537 or 31% completed the InnerSight Experience while 1,213 or 69% in the control group did not.
Attainment: The Attainment outcome measure was deemed appropriate for a total of 1,691 youth participants of which 624 were in-school-youth (37%) and 1067 were out-of-school youth (63%). A total of 624 participants completed the InnerSight assessment experience (37%) while 1067 (63%) in the control group did not have the Experience.
Of the in-school youth, 260 or 42% completed the InnerSight Assessment Experience while 364 or 58% in the control group did not. Of the out-of-school youth participants for this measure 364 or 34% completed the InnerSight Experience while 703 or 66% in the control group did not.
Table 1Participant Demographic Informationby InnerSight Experience and Control Group2015-16
|
Participant Groups |
Literacy Assessmenta |
Placement Assessment |
Attainment Assessment |
|||
|
N |
Average Age |
N |
Average Age |
N |
Average Age |
|
|
Overall |
1,727 |
19.0 |
2,353 |
18.6 |
1691 |
18.4 |
|
InnerSight |
682 |
18.9 |
793 |
18.4 |
624 |
18.3 |
|
Control |
1,045 |
19.1 |
1,560 |
18.7 |
1,067 |
18.4 |
|
In-school youth: |
||||||
|
InnerSight |
NA |
256 |
17.3 |
260 |
17.3 |
|
|
Control |
NA |
347 |
17.4 |
364 |
17.5 |
|
|
Out-of-school youth: |
||||||
|
InnerSight |
682 |
18.9 |
537 |
19.0 |
364 |
19.0 |
|
Control |
1,045 |
19.1 |
1,213 |
19.0 |
703 |
19.0 |
| a -All participants on Literacy Outcome measure are Out-of-School Youth. | ||||||
Information for gender and ethnicity of participants was not available in the data extract provided by the City of Los Angeles from the “Jobs LA” performance tracking system. However, the City of Los Angeles did provide total program gender and ethnicity information for program year 2015-16 reflecting a robust and diverse population of participating youth. For 2015-16, there were 1,947 females (54.4%) and 1,630 males (45.6%). The reported ethnic makeup, as expected, is very diverse with the largest reporting group being Hispanic or Latino followed by White and African American/Black. The mix of Race or Ethnicity in the population is so large that participants are permitted to select more than one race or ethnicity suggesting that the standard race identification categories are rapidly becoming ineffective demographic descriptors or study variables for this population.
Analysis: As Borden (2009) suggests, a good measure must produce a rate of success and not simply a count of activities. Therefore, the rate of success on each of the WIOA outcome measures (Literacy, Placement and Attainment) will be calculated for participants appropriate for assessment on each measure as an indicator of program performance. To assess the impact of the InnerSight Assessment Experience, the percent succeeding on each measure is compared for those who had the InnerSight Assessment Experience with those who did not have the Experience (control group). Differences in rate of performance will be analyzed using chi-square to determine if they are significant or if they occurred by chance alone.
Testing the significance of gains associated with the InnerSight Experience between 2014-15 and 2015-16 will use analysis of variance to examine the difference between the Control group and InnerSight group; the difference in performance between the first year and the second-year participants; and for the interaction. The interaction measures whether the gains, if any, for the InnerSight populations between the first and second year are statistically larger than the gains, if any, experienced by the Control groups. A significant interaction will identify if programs and case managers become more effective with the InnerSight Assessment Experience outcomes across time.
Results
The performance rates of participating youth successfully meeting the performance standard for program year 2015-16 are provided in Table 2 for each of the three outcome measures. The overall rate of successful performance is 75% for Placement, 60% for Attainment and 56% for Literacy. Table 2 reveals considerable variance in performance rates between in-school youth and out-of-school youth as well as between those who have had the InnerSight Assessment Experience and those who have not on the Placement and Attainment outcomes. Performance rate comparisons and examination of significant differences are provided below by WIOA outcome measure.
Table 2Rate of Successful Performance 2015-16:Percent of Participating Youth Achieving Outcome Measure
|
Literacy Outcome1 |
Placement Outcome |
Attainment Outcome |
|
|
All Participants |
56% |
75% |
60% |
|
InnerSight |
57% |
81% |
74% |
|
Control |
56% |
71% |
52% |
|
In-school youth: |
80% |
81% |
|
|
InnerSight |
– |
88% |
94% |
|
Control |
– |
74% |
71% |
|
Out-of-School youth: |
56% |
73% |
48% |
|
InnerSight |
57% |
79% |
60% |
|
Control |
56% |
70% |
43% |
| 1All participants on Literacy Outcome measure are Out-of-School Youth. |
|||
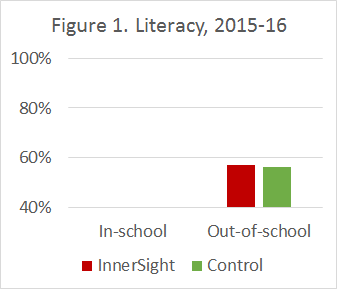
Literacy: Only out-of-school youth participate in the Literacy outcome measure. For the 2015-16 program year population, 56% met the standard. Those who had The InnerSight Assessment Experience had a 57% success rate while those who did not have the InnerSight Experience achieved a 56% success rate (see Figure 1). The 1% difference in performance rate for those completing the InnerSight Experience is not statistically significant (X2(1, N=1,727)=0.504, p=.478). InnerSight Assessment Experience participants are no more likely than other participants to achieve the Literacy standard. This result is different from program year 2014-2015 findings in which InnerSight participants significantly outperformed the control group by 6% (X2(1, N=1,665)=3.99, p=.046).
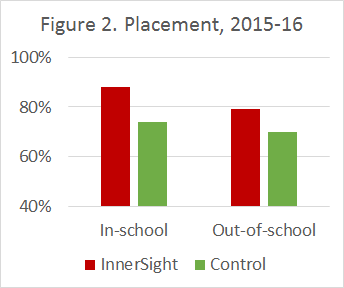
Placement: For the 2015-16 program year, 75% successfully met the Placement outcome measure standard as can be seen in Table 2. The performance measure success rate for those who had the InnerSight Assessment Experience was 81% while the success rate for those who did not have the Experience was 71%. This suggests that those who have the InnerSight Experience are more likely to achieve success on the Placement outcome performance measure than those who do not. The 10% difference in performance rate for InnerSight Experience participants was statistically significant, yielding a χ2 value of 20.5, with 1df, N=2,353 and a probability of p = .000. This finding is different from the 2014-15 program year study in which no difference was found on this measure for any category.
The impact of the InnerSight Assessment Experience on the Placement outcome differs dramatically for in-school and out-of-school youth (see Figure 2). The success rate of 88% for in-school youth on the Placement measure who had the InnerSight Experience was a statistically significant 14% greater than the 74% success rate for in-school youth who did not have the Experience. The statistical analysis yielded a χ2 value of 16.5 with 1df and an N=603 with a probability of p = .000.
Examination of the success rates for the WIOA critical population of out-of-school youth shows that those who complete the InnerSight Assessment Experience are significantly more likely than their peers to achieve success on the Placement performance measure. The success rate on the Placement outcome measure for those having the InnerSight Experience is 79% versus 70% for those who do not. This 9% difference in performance rate is statistically significant yielding a χ2 value of 12.9 with 1df, an N of 1,750 and a probability of p = .000.
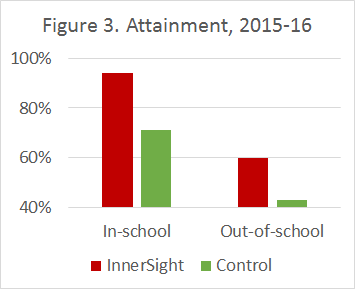
Attainment: For the 2015-16 program year, 60% successfully met the Attainment outcome measure standard as can be seen in Table 2. The performance measure success rate for those who had the InnerSight Experience was 74% while the success rate for those who did not have the Experience was 52%. This suggests that those who have the InnerSight Assessment Experience are more likely to achieve success on the Attainment outcome performance measure than those who do not. The 22% difference in performance rate for InnerSight Experience participants was statistically significant, yielding a χ2 value of 78.3, with 1df, N=1,691 and a probability of p = .000. This difference is 11% larger than the significant difference found for all participants in the 2014-15 program year study.
The impact of the InnerSight Assessment Experience on the Attainment outcome differs for both in-school and out-of-school youth (see Figure 3). The success rate of 94% for in-school youth on the Attainment measure who had the InnerSight Experience was significantly greater than the 71% success rate for in-school youth who did not have the Experience. The statistical analysis yielded a χ2 value of 51.1 with 1df and an N=624 with a probability of p = .000. This 23% difference is considerably larger than the statistically insignificant 6% measured in program year 2014-15.
Examination of the success rates for the WIOA critical population of out-of-school youth shows that those who complete the InnerSight Assessment Experience are significantly more likely than their peers to achieve success on the Attainment performance measure. The success rate on the Attainment outcome measure for those having the InnerSight Experience is 60% versus 43% for those who do not. This 17% difference in performance rate is statistically significant yielding a χ2 value of 28.9 with 1df, an N of 1,067 and a probability of p = .000. This difference is greater than the 14% difference in the 2014-15 program year, which was also statistically significant. What is most interesting, however, is the InnerSight Experience in 2015-16 levels the playing field for out-of-school youth who achieve a performance success rate equal to that of the overall population at 60%.
Research Question 1- the results show that youth who have the InnerSight Assessment Experience achieve successful performance on the Placement and Attainment performance measures at a significantly greater rate than those who do not have the Experience. With regard to the Literacy outcome measure, rate of performance is not impacted by the InnerSight Experience in the 2015-16 program year. The findings for Attainment were consistent and stronger for all groups over the 2014-15 program year. While Placement did not reveal any significant differences in 2014-15, the 2015-16 study found substantial significant differences across all participant levels.
Research Question 2- the results show a significant difference between the successful performance rate of out-of-school youth (WIOA’s primary target group) who have the InnerSight Assessment Experience and those who do not on the Attainment and Placement outcome measures in this study. Out-of-school youth who had the InnerSight Experience performed significantly better on the Attainment outcome measure (+17%) and on the Placement outcome measure (+9%) than those who did not have the Experience. The findings for Attainment were consistent and stronger for all groups over the 2014-15 program year. While Placement did not reveal any significant differences in 2014-15 program year, this study found significant differences in 2015-16 across all participant levels. The statistically significant impact of the Experience on the Literacy measure in 2014-15 was somewhat weak (a 6% difference) and was not affirmed in the 2015-16 replication. The InnerSight Experience is not designed to improve the kind of outcomes associated with the Literacy measure so this insignificant result is not surprising.
Analysis of Gain
Research question three seeks to understand if there are significant improvements in the impact of the InnerSight Experience between program years 2014-15 and 2015-16. Data identifying between-year changes in performance of InnerSight Assessment Participants on the Literacy, Placement and Attainment measures are provided in Table 3 (also see Appendix A for statistical results).
Table 3InnerSight Participant Performance Change Across Program Years2014-15 to 2015-16
|
InnerSight Participants |
Literacy1 14-15 15-16 Change |
Placement 14-15 15-16 Change |
Attainment 14-15 15-16 Change |
||||||
|
Total |
48% |
57% |
+9% |
69% |
81% |
+12% |
58% |
74% |
+16% |
|
In-school |
– |
– |
71% |
88% |
+17% |
85% |
94% |
+9% |
|
|
Out-of-school |
48% |
57% |
+9% |
69% |
79% |
+10% |
43% |
60% |
+17% |
| 1All participants on Literacy Outcome measure are Out-of-School Youth. | |||||||||
On the Literacy outcome, InnerSight participant performance increased by 9%, from 48% to 57%. This 9% change for InnerSight participants is statistically significant, yielding a χ2 value of 6.58 with 1df, an N of 682 and p=.010. Performance on the Literacy outcome is stronger for 2015-16 InnerSight participants than in the first year.
Gain in performance on the Placement outcome is 12% between 2014-15 and 2015-16 for InnerSight participants. This change in performance for the InnerSight participants on Placement is statistically significant, yielding a χ2 value of 21.07 with 1df, an N of 793 and p=.000.
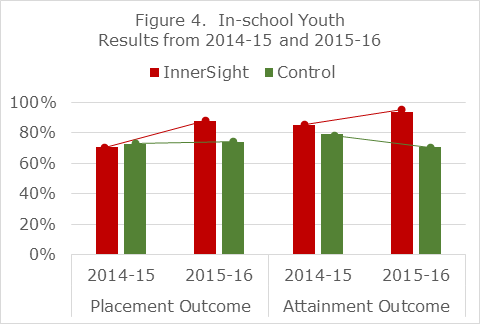
Similar results are found when examining the change in performance for the in-school and out-of-school participants on Placement. For in-school youth, the InnerSight Assessment participant outcomes significantly increased 17% (χ2 value of 14.34 with 1df, an N of 256 and p=.000). For out-of-school youth, InnerSight participant outcomes significantly increased 10% (χ2 value of 9.33 with 1df, an N of 537 and p=.002).
On the Attainment outcome, InnerSight participants’ success rate increased by 16% between 2014-15 and 2015-16. This was a significant improvement (χ2 value of 24.98 with 1df, an N of 624 and p=.000). For in-school youth, InnerSight participants’ outcomes significantly increased 9% on Attainment (χ2 value of 8.99 with 1df, an N of 260 and p=.003). For out-of-school youth, InnerSight participant success significantly increased 17% (χ2 value of 14.91 with 1df, an N of 364 and p=.000).
Research Question 3- the results show that the impact of the InnerSight Assessment Experience on WIOA outcome measures of Attainment, Literacy and Placement grew significantly between program years 14-15 and 15-16, for all participants as well as for the in-school and out-of-school youth.
The final research question seeks to understand if gains between years in performance of InnerSight Assessment Experience participants are significantly larger than those for the control group on the WIOA outcome measures. Analysis of variance was used to determine if InnerSight participant gains are significantly larger than gains for the control group (see Appendix A, Note 1).
On the Literacy measure, both the InnerSight and Control groups improved, but the size of the improvement for each group is statistically equal. The 9% gain for InnerSight is statistically equal to the 14% gain for the Control group (F1,1726=3.095, ns). The gain experienced by InnerSight participants may have resulted from some systemic difference that affected both groups equally for the Literacy outcome.
On the Placement measure, the 11% difference in performance gains between the InnerSight participants and the control group was statistically significant (F1,2352=11.315, p=.001). For in-school youth the 16% difference was also significant (F1,602=7.140, p=.008), as was the 9% difference for out-of-school youth (F1,1749=4.804, p=.028). In all comparisons, the gains between 2014-15 and 2015-16 for InnerSight participants on the Placement outcome were significantly larger than those for the control group.
On Attainment, the 11% difference in performance gains between the InnerSight participants and the control group was statistically significant (F1,1690=7.732, p=.005) as was the 17% difference for the in-school youth (F1,623=11.636, p=.001). For the out-of-school youth, the 17% improvement by the InnerSight participants (from 43% to 60%) and the 14% improvement by the control group (from 29% to 43%) were large and statistically significant, but the 3% difference in these improvements is not significant (F1,1066=0.461, ns). As with the Literacy measure, the gains between 2014-15 and 2015-16 documented for research question three for the InnerSight participants may have been influenced by some systemic difference affecting all participants equally.
Figures 4 and 5 reflect changes in performance for in-school and out-of-school youth, respectively.
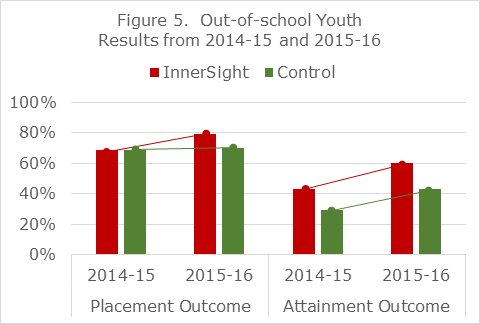
Research Question 4- the results show that except for one instance the performance gains for the InnerSight Assessment Participants on Placement and Attainment outcomes are significantly larger than those for the control group. No significant differences were identified on the Literacy outcome.
Discussion
The literature has offered virtually no research on program elements that impact youth success on WIOA performance outcomes. Existing research (Moore and Gorman, 2004) focused only on the impact of participant demographic characteristics on outcome measures. Borden (2009) noted that performance management systems do not specify how services are delivered and that measures of program performance must produce a rate of success and not simply a count of activities. The Perkins, et al. (2016) study responded to both concerns with a focus on the InnerSight Assessment Experience as a program element in service delivery and examined its impact on participant rate of performance on WIOA outcome measures.
The Perkins, et al. (2016) finding that out-of-school youth met the Attainment performance standard at a 14% greater rate if they have the InnerSight Assessment Experience (43%) than those who do not (29%) had both statistical and practical significance. It demonstrated that program elements influence participant performance on WIOA outcome measures. Results were similar on the Literacy outcome measure with a 6% significantly greater rate of performance for out-of-school youth who had the InnerSight Experience (48%) than those who did not (42%). The Placement outcome measure performance rate was not influenced by the InnerSight Experience.
This follow-up study reveals a continuing impact for the InnerSight Assessment Experience on the WIOA outcome of Attainment and establishes a similarly significant positive impact on Placement. The results on Literacy, while larger for the InnerSight Experience group than the control group, did not result in a significant difference between those two groups.
The analysis of gains across program years shows significant improvements for all groups across all outcome measures. What is interesting is that, while all groups improve across years, the gains by InnerSight Assessment Experience participants are significantly larger than those for the control group on Attainment and Placement in most comparisons. This suggests that effectiveness in working with InnerSight Experience outcomes may improve over time. Case managers in 2015-16 not only had more on the job experience using InnerSight outcomes with youth; they also participated in additional InnerSight professional development training. Regular professional development and reinforcement of the effective use of program materials may contribute to gains in outcomes.
Performance gains for the control group are worthy of note (See Note 2 Appendix A). YouthSource case managers participate in the InnerSight Facilitating the Journey professional development training and work with all participants. It is possible that case managers who work with the InnerSight tool begin to work differently, and more effectively, with their non-InnerSight participants.
Examination of this impact, while beyond the scope of this effort, would yield important insights regarding case manager development. It would similarly be interesting to examine performance results to determine if InnerSight participant results are influenced by program site.
The target population for this study was young people who are the most persistently disconnected. Perkins et al. (2017), found that the InnerSight Assessment Experience is an intensive interpretive program element that works by engaging youth. When case managers follow up using the InnerSight Experience outcomes to chart next steps to educational and occupational goals, the results are personally engaging, developmental, and productive. This is one of those new strategies Hossain (2015) suggests is needed and should be a priority in reaching and engaging alienated and disaffected young people.
Hossain recommends “asking young people for their input in designing program activities and allowing them to have a voice in program governance.” (p.4) The InnerSight Experience capitalizes on this by increasing the youth’s voice in the use of personalized assessment results in designing a personal pathway to success. This is particularly productive in establishing individualized short-term and long-term goals as required by WIOA in each youth’s Individual Service Plan.
Kazis (2016) suggests there is a paucity of research on how to positively engage the participant in his/her personal development of a successful career pathway. The findings of Perkins et al. (2016, 2017) along with this study respond to this concern suggesting effective use of personal assessment results is a powerful building block. Far too often, assessment is viewed as something we do to people, or for them, rather than with them. Thus, we lose the opportunity for meaningful engagement and personal exploration, sacrificing the power of personal validation. Such engagement takes time and some professional expertise with the assessment tool which often is not available in many WIOA programs as it was in this study. Case managers using the InnerSight Experience materials have learned to work with youth to discuss and plan together important educational and career next steps. Such collaborative work leads to the program impact and gains in performance outcomes found in this study.
Service program elements have a profound impact on WIOA performance outcomes. The City of Los Angeles YouthSource program has focused on positive youth development by establishing a common program element across the City. This consistent program effort produces significant WIOA results. These program accomplishments are realized by “Putting the Person in the Process”.
References
Barnow, B. S., and Smith, Jeffrey. “Performance Management of U.S. Job Training Programs: Lessons from the Job Training Partnership Act.” Public Finance and Management, vol. 4, no. 3, 2004, pp. 247-287.
Borden, William S., Nov. 2009 Mathematica Policy Research, The Challenges of Measuring Employment Program Performance, in a paper delivered at the 2009 conference What the European Social Fund Can Learn from the WIA Experience. Retrieved from http://www.umdcipe.org/conferences/WIAWashington/Papers/Borden-Challenges-of-Measuring_Employment_Program_Performance.pdf
Dawes, N.P., Larson, R. (2011), How Youth Get Engaged: Grounded-theory research on motivational development in organized youth programs. Developmental Psychology, Vol 47(1), Jan 2011, pp 259-269.
Dunham, K., Mack, M., Salzman, J., Wiegand, A., May 2006, Evaluation of the WIA Performance Measurement System – Final Report. Retrieved from https://wdr.doleta.gov/research/FullText_Documents/Evaluation%20of%20the%20WIA%20Performance%20Measurement%20System%20-%20Final%20Report.pdf
Hossain, Farhana (2015). Serving Out-of-School Youth Under the Workforce Innovation and Opportunity Act (2014). Retrieved from http://www.mdrc.org/publication/serving-out-school-youth-under-workforce-innovation-and-opportunity-act-2014
Kazis, Richard (2016). MDRC Research on Career Pathways. Retrieved from http://www.mdrc.org/publication/mdrc-research-career-pathways
King, C. T. (2004). The effectiveness of publicly financed training services: Implications for WIA and related programs. In C. J. O’Leary, R. A. Straits, & S. A. Wandner (Eds.), Job training policy in the United States. Kalamazoo, MI: W. E. Upjohn Institute for Employment Research.
Moore, R. W., Gorman, P. C., Blake, D. R., Phillips, G. M., Rossy, G., Cohen, E., Grimes, T., & Abad, M. (2004). Lessons from the past and new priorities: A multi-method evaluation of ETP. Sacramento, CA: California Employment Training Panel.
O*NET OnLine. Retrieved from: https://www.onetonline.org/
Perkins, M.L., Reeves, J.E., Furlong, D.K., Pazur, E.A. (2017), City of Los Angeles YouthSource Assessment Experience Increases WIOA Performance Through Youth Engagement. Retrieved from https://www.myinnersight.com
Perkins, M.L., Reeves, J.E., Mancheno-Smoak, L., Furlong, D.K. (2016), Assessment Program Impact on Successful WIOA Program Performance in the City of Los Angeles YouthSource Program. Retrieved from https://www.myinnersight.com/impact-study-v2/
Rickman, A. N. (2009). A challenge to the notion of youth passivity: Adolescents’ development of career direction through youth programs (Unpublished master’s equivalency paper). University of Illinois at Urbana–Champaign
Social Policy Research Associates. (2004). The Workforce Investment Act after Five Years: Results from the National Evaluation of the Implementation of WIA. Retrieved from https://www.doleta.gov/reports/searcheta/occ/papers/spr-wia_final_report.pdf
United States Department of Labor, Employment and Training Administration (2015). Retrieved from https://www.doleta.gov/performance/guidance/laws_regs.cfm
United States Departments of Education, Health and Human Services, and Labor, “Joint Career Pathways Letter,” April 4, 2012. Retrieved from http://www2.ed.gov/news/newsletters/ovaeconnection/2012/04122012.html.
Appendix A: Statistical NotesNote 1: Statistical Results for Between Year Changes and Gains
|
Literacy
|
Program Year
|
Chi Square
|
P value
|
Correlation
|
Change
|
Significance
|
|
| 14-15 | 15-16 | ||||||
|
Out-of-school Youth: |
43% |
56% |
63.09 |
0.000 |
0.136 |
13% |
Both InnerSight and Control groups improved equally (F=3.095, p=.079) |
|
InnerSight |
48% |
57% |
6.58 |
0.010 |
0.083 |
9% |
|
|
Control |
42% |
56% |
47.09 |
0.000 |
0.139 |
14% |
|
|
Placement
|
Program Year
|
Chi Square
|
P value
|
Correlation
|
Change
|
Significance
|
|
| 14-15 | 15-16 | ||||||
|
All Participants |
70% |
75% |
12.97 |
0.000 |
0.054 |
5% |
|
|
InnerSight |
69% |
81% |
21.07 |
0.000 |
0.135 |
12% |
The improvement for InnerSight participants is significantly greater (F=11.315, p=.001) |
|
Control |
70% |
71% |
0.64 |
0.424 |
0.014 |
1% |
|
|
In-school Youth |
73% |
80% |
8.38 |
0.004 |
0.085 |
7% |
Both In-school and Out-of-School groups improved equally (F=1.074, p=.300) |
|
Out-of-school Youth |
69% |
73% |
6.57 |
0.010 |
0.045 |
4% |
|
|
In-school Youth: |
73% |
80% |
The improvement for InnerSight participants is significantly greater (F=7.140, p=.008) |
||||
|
InnerSight |
71% |
88% |
14.34 |
0.000 |
0.198 |
17% |
|
|
Control |
73% |
74% |
0.14 |
0.706 |
0.013 |
1% |
|
|
Out-of-school Youth: |
69% |
73% |
The improvement for InnerSight participants is significantly greater (F=4.804, p=.028) |
||||
|
InnerSight |
69% |
79% |
9.33 |
0.002 |
0.109 |
10% |
|
|
Control |
69% |
70% |
0.65 |
0.420 |
0.016 |
1% |
|
|
Attainment
|
Program Year
|
Chi Square
|
P value
|
Correlation
|
Change
|
Significance
|
|
| 14-15 | 15-16 | ||||||
|
All Participants |
49% |
60% |
39.90 |
0.000 |
0.111 |
11% |
|
|
InnerSight |
58% |
74% |
24.98 |
0.000 |
0.164 |
16% |
The improvement for InnerSight participants is significantly greater (F=7.732, p=.005) |
|
Control |
47% |
52% |
6.04 |
0.014 |
0.051 |
5% |
|
|
In-school Youth |
80% |
81% |
0.04 |
0.850 |
0.005 |
1% |
The improvement for Out-of-school Youth is significantly greater (F=24.846, p=.000) |
|
Out-of-school Youth |
32% |
48% |
60.84 |
0.000 |
0.172 |
16% |
|
|
In-school Youth: |
80% |
81% |
The improvement for InnerSight participants is significantly greater (F=11.636, p=.001) |
||||
|
InnerSight |
85% |
94% |
8.99 |
0.003 |
0.156 |
9% |
|
|
Control |
79% |
71% |
7.13 |
0.008 |
-0.093 |
-8% |
|
|
Out-of-school Youth: |
32% |
48% |
Both InnerSight and Control groups improved equally (F=.461, p=.497) |
||||
|
InnerSight |
43% |
60% |
14.91 |
0.000 |
0.163 |
17% |
|
|
Control |
29% |
43% |
30.84 |
0.000 |
0.144 |
14% |
|
Note 2: Comparison of Difference inInnerSight and Control Group PerformancePY 2014-15 to PY 2015-16
|
Participants |
Literacy1 |
Placement |
Attainment |
||||||
|
PY 14-15 |
PY 15-16 |
Change |
PY 14-15 |
PY 15-16 |
Change |
PY 14-15 |
PY 15-16 |
Change |
|
|
All Participants |
|||||||||
|
InnerSight |
69% |
81% |
58% |
74% |
|||||
|
Control |
70% |
71% |
47% |
52% |
|||||
|
Difference between InnerSight and Control group |
-1% |
10% |
11%** |
11% |
22% |
11%** |
|||
|
In-school Youth: |
|||||||||
|
InnerSight |
71% |
88% |
85% |
94% |
|||||
|
Control |
73% |
74% |
79% |
71% |
|||||
|
Difference between InnerSight and Control group |
-2% |
14% |
16%** |
6% |
23% |
17%** |
|||
|
Out-of-school Youth: |
|||||||||
|
InnerSight |
48% |
57% |
69% |
79% |
43% |
60% |
|||
|
Control |
42% |
56% |
69% |
70% |
29% |
43% |
|||
|
Difference between InnerSight and Control group |
6% |
1% |
-5% |
0% |
9% |
9%* |
14% |
17% |
3% |
| 1All participants on Literacy Outcome measure are Out-of-School Youth. | |||||||||
| *Difference is statistically significant at .05 | |||||||||
| ** Difference is statistically significant at .01 | |||||||||
City of Los Angeles YouthSource Assessment Experience Increases WIOA Performance Through Youth Engagement
Mark L. Perkins, John E. Reeves, Deborah K. Furlong, Emily A. Pazur
Abstract
Putting the Person in the Process is key to the City of Los Angeles YouthSource program performance. Los Angeles’ YouthSource Assessment Experience significantly impacts the rate of success on WIOA outcome measures. Qualitative analysis of 899 youth evaluations of the Assessment Experience shows that youth motivation is fostered in the formative InnerSight Assessment Experience in which youth authentically verify and connect their interests to potential career pathways. This study reveals the characteristics of the formative Assessment Experience which are meaningful to youth. It confirms youth need not enter the Experience intrinsically engaged as found by Dawes and Larson (2011) as the Experience fosters personal connection leading to engagement and subsequent performance.
The City of Los Angeles Economic Workforce Development Department (EWDD) offers the InnerSight Assessment Experience as a consistent program element across its 13 YouthSource service sites. Perkins et al. (2016) found this program element significantly impacted youth performance on Workforce Innovation and Opportunity Act (WIOA) performance outcomes (US Department of Labor, 2015) They recommended examination of participants’ narrative evaluation statements to understand how the Assessment Experience impacts youth performance.
Background
The city of Los Angeles YouthSource program is a premier provider of service for in and out-of-school youth. The city serves some 17,000 youth in its annual and summer programs. The Los Angeles YouthSource program has been nationally acclaimed by the Department of Labor for its progressive commitment to serving out-of-school youth. In 2012, before the new WIOA service requirements, the City made a substantial commitment to serving this population when it required that 70% of the youth served at its 13 YouthSource sites be out-of-school youth. As a result, they have become the nation’s most successful program in addressing the needs of this underserved population.
YouthSource program leadership desired to offer a consistent program element to serve youth across its 13 sites. Most importantly they wanted a program element that is developmental for each participant while meeting WIOA expectations and requirements. Specifically, they were seeking a program that would accomplish the following:
- Actively engage participants in the development of their individual plan.
- Provide caseworkers with a foundation for development of individual plans grounded in participant’s assessment results.
- Connect individual plans and strategies to specific educational, training and occupational goals.
- Help caseworkers and clients see those skills needed to achieve occupational fit.
- Provide documentation of participant and case manager mutual engagement and results oriented planning.
They believe a program grounded in participant personal development that connects youth with high demand occupations using their preferences and interests will facilitate persistence in the attainment of educational, training and career goals. To accomplish this, the city issued an RFP and selected the InnerSight Assessment Experience to meet this unique program and developmental objective.
The InnerSight Assessment Experience
The InnerSight Experience™ gives participants a vocabulary, context, and framework for bringing their personal interests and preferences to bear on life’s choices. This experience puts the “Power of the Person” in the decision-making processes of life. Through the Experience, participants come to see they are the “Key” to their personal, educational, and career training choices and gain important information about themselves upon which to reflect when making those choices.
The InnerSight Assessment Experience consists of an online interest and preference inventory (The Strong Interest Inventory®) resulting in a personalized InSight Guide booklet which is the foundation for a 3-hour, formative, in-person, group interpretative experience. This interactive experience cognitively and psychologically engages participants in individual and group exercises that emphasize and highlight the distinctiveness of their personal results. By self-validating their personal interests and preferences for working, learning, leading, risk-taking, and team orientation, participants are equipped to explore occupations of people who are satisfied in various occupations and share the participants’ interests.
When interests and preferences are aligned with an occupation (work tasks), satisfaction, happiness, and superior performance occur. Youth with cultural, familial, and economic barriers are no exception. When engaged in subjects of interest (music, dance, skateboarding, etc.), individuals succeed.
The InnerSight Experience is grounded in the prolific research and universally acclaimed Work Types Model of the eminent vocational psychologist Dr. John Holland. The Holland Model was adopted by the Department of Labor as the foundation for their online career exploration system O*NET. This system can be directly accessed from the electronic Insight Guide booklet participants receive after completing the InnerSight Experience by simply clicking on a preferred occupation.
For over 90 years, interests and preferences have been known as key factors in motivation. Using interests and preferences to help individuals make better life choices is a time-tested and valid approach for assuring continued effort/success in education, career, and personal life.
InnerSight uses this approach, but has changed the traditional career assessment/exploration model. Youth are accustomed to being processed; that is, being asked what they know (education), or being told what they need to know and do next. InnerSight begins the journey by first exploring and having participants validate what they may like or enjoy doing. Additional exercises guide the participants to discover the connection between what they enjoy doing and potential occupations in which people who share their interests are satisfied.
The InnerSight Assessment Experience continues when participants meet with their case managers to begin Next Steps planning in the InSight Guide booklet based on their self-validated results. Case managers who work with the youth complete the InnerSight Experience and training in “Facilitating the Journey.” “Facilitating the Journey” training provides case managers with the simple skills needed to engage the participant in a meaningful discussion of their results and use them as the foundation of the individual service plan.
Each InnerSight Experience session is evaluated by the participants. Their ratings provide continuous feedback on characteristics of the Experience from the InSight Guide booklet to facilities and the accuracy of their results. In addition, they are asked to respond to three open-ended questions regarding what they liked, what they would change, and any additional thoughts they might have. These personal responses provide a rich source of qualitative information for understanding, in participants’ words, how they were impacted by the Experience.
The InnerSight Assessment Experience is designed to help WIOA staff align youth and adults with education, training programs, internships, and actual job openings that are a best fit for them. This approach has been empirically demonstrated to increase youth performance on WIOA outcome measures. To better understand why it works, this study examines the youth’s perceptions of the Assessment Experience using their written evaluations.
Literature
Research on youth engagement, formative assessment and WIOA program impact offer a context for understanding and interpreting InnerSight Assessment Experience evaluations.
WIOA Program Impact
Moore and Gorman (2009) observed “there is little in depth analysis of the performance of the WIA system or of the likely drivers of the new common measures. Specifically, there has been little published on the relationship between individual participant characteristics and the program performance measures.” They found demographic characteristics such as age, ethnicity, education etc. account for considerable variance in performance outcomes. They observe “there is a need for researchers to undertake more nuanced studies—-of training most likely to lead to successful outcomes.” (p. 394), thus there is a need for providers to understand what program elements, assessments, or experiences have a positive impact on participants’ performance on the common WIA metrics.
Finding no other research identifying program element impact, Perkins, Reeves, Mancheno-Smoak, Furlong (2016) conducted an empirical examination of the impact of the InnerSight Assessment Experience on youth WIOA performance outcomes in the City of Los Angeles YouthSource program in program year 14-15. Performance of youth who had the InnerSight Assessment Experience was compared with those who did not have the Experience on WIOA outcomes.
InnerSight Assessment Experience Youth were found to significantly outperform those who did not have the Experience on Attainment and Literacy. There was an 11% improvement in success rate for all youth in the InnerSight group over the control group on the Attainment performance measure. The Attainment performance success rate for out-of-school youth was 14% higher for those who completed the InnerSight Assessment Experience. There was a 6% improvement for the InnerSight Assessment participants on Literacy over the control group. No significant difference on the Placement outcome measure was identified. This study is the first to link a program element to increases in youth outcome measures.
Perkins, Reeves, Furlong (2017) replicated the 2016 study looking at program year 15-16 outcomes. Youth Attainment success rate was 74% for InnerSight participants compared to 52% for non-participants, for a significant difference of 22%. In-school youth with InnerSight had a 94% success rate compared to 71% for those who did not, for a significant difference of 23%. Out-of-school participants with InnerSight had a success rate of 60% compared to 43% for those without InnerSight, for a 17% significant difference, which was 3% higher than in the previous study.
The InnerSight Assessment Experience was also found to positively impact Placement in the 15-16 program year study. The InnerSight in-school group performance was 88%, while the control group was 74% for a 14% difference. The out-of-school InnerSight Experience group performance was 79%, while the control group achieved 70% on the Placement outcome.
This research, while demonstrating the relationship between a program element and success in achieving WIOA outcome measures, does not assist in understanding why or how the program works. Understanding how participants feel a program impacts them could provide valuable insight into effectively working with out-of-school youth.
Youth Engagement
Kazis (2016) in a research brief on Career Pathways observes “there is little rigorous research that assesses the impact of comprehensive career pathways programs that follows individuals from different starting points through a coherent set of educational experiences and “stackable” credentials to the labor market.” (p. 2). Kazis further suggests there is a paucity of research on how to positively engage the participant in his/her personal development of a successful career pathway.
Dawes and Larson (2011), in a qualitative study, examine how youth engagement develops based on 44 youth narrative accounts of their experience in youth programs. Drawing on theories of psychological engagement such as flow, interest and self-determination, the authors suggest youth engagement emerges from personal connection.
Flow theory (Csikszentmihalyi, 1975: Csikszentmihalyi, Rathunde, & Watson, 1993) suggests deep engagement occurs when people experience the challenges in an activity as matched to their skills (not too hard or too easy relative to skill level) The challenges, however, must also have some meaning for the participant.
Interest theory is like Flow in that the activity must be personally meaningful involving “focused attention, increased cognitive functioning, persistence and affective involvement.” (Hidi, 2000, p. 312). However, for interests to be sustained over time, a person needs to gain a base of knowledge about the activity and develop positive subjective feelings toward it. (Hidi & Renninger, 2006)
Psychological engagement occurs, according to Self-Determination Theory (SDT), when the activity requires the participant to be associated with more than just meaning or positive feelings; the activity must be integrated into self. In this theory, psychological engagement varies as a function of how much a person has internalized the goals of the activity. (Ryan & Deci, 2000) Increased motivation and engagement occurs on a continuum as a person identifies with, internalizes, and integrates the activity’s goals into the self-system. Strongest motivation occurs when participation in an activity is completely internally regulated (Ryan & Deci, 2000). Further research reveals that the processes of internalization are driven by three basic universal psychological needs of the self: competence, autonomy and relatedness. (Ryan & Deci, 2000)
Dawes and Larson (2011), building on these theories and the narrative research data in their study, developed the following operational definition of “forming a personal connection” to guide their research:
“The process of coming to experience program activities as having important relevance and meaning to their lives. This relevance or meaning may be related to personal values or standards, personally meaningful interests or ambitions, or personal identity.” (p. 263)
They found that “Youth described this personal connection as occurring through changes in both themselves (developing knowledge, skills, values, future goals) and in their perception of the activity (seeing new things in it, learning its relevance to goals). The process appeared to involve experiencing increased convergence between self and the activity.” (p. 263)
They discovered personal connections fit into three categories: learning for the future, developing a sense of competence, and pursuing purpose.
Learning for the future – The largest number of youth attributed the change in their psychological engagement to “a connection they discovered between the skills they were learning through participating in program activities and goals for their future” (p. 263) and “…engagement or motivation in the activity became stronger as they realized that they were gaining knowledge, exploring and developing skills that would be valuable to them later, often for a desired college major or career choice” (p. 264). In a separate analysis focused on helping youth think about career choices Rickman (2009) describes this process as that of “finding fit”.
Developing a sense of competence – For a second group of youths in the study “Doing well in program activities….and having that acknowledged by others …. provided meaningful self-affirmation. This experience of competence connected youth to program activities and fueled motivation to pursue new challenges in the program”. (p. 264)
Pursuing purpose – A third group reported increased psychological engagement when “forming personal connections to goals that transcended their own self-interest”. (p. 265)
Dawes and Larson (2011) concluded “For youth to benefit from many of the developmental opportunities provided by organized programs, they need to not only attend, but become psychologically engaged in program activities”. Their research reveals that “youth who experience a positive turning point in their motivation or engagement” do so through a change process that involves forming a personal connection. The authors observe, “that youth need not enter programs intrinsically engaged—motivation can be fostered—and that programs should be creative in helping youth explore ways to form authentic connections to program activities”. (p. 1)
WIOA encourages implementation of career pathway approaches that support post-secondary education and training for out-of-school youth that is related to the demand for qualified workers in local labor markets. However, research shows that many high-school-aged youth have little knowledge about or commitment to career pathways (Schneider & Stevenson, 1999) and as suggested by Meijers (1998), this can create anxiety and avoidance. Findings in Dawes and Larson (2011) tell us “that when youth do begin to connect to meaningful career paths, it can create a marked increase in their motivation and engagement”. (p. 266)
The Workforce Innovations and Opportunity Act expects the individualized pathway to be grounded in an assessment of skills and interests to inform participants’ career decision-making when identifying logical short-term next steps consistent with long-range goals. Formative assessment approaches have been shown to be valuable in accomplishing this important developmental goal.
Formative Assessment – A Context for Youth Engagement
Nichols and Dawson (2012) see assessment as a context for student engagement, observing “that summative testing systems tend to connect with traditional motivation processes such as goals and efficacy-related beliefs, whereas formative systems tend to connect with engagement-related processes such as self-regulated learning and self-determination.” They suggest formative assessment requires active participation of the learner.
Black and Wiliam (1998) state: “The core activity of formative assessment lies in the sequence of two actions. The first is the perception by the learner of a gap between a desired goal and his or her present state (of knowledge, and/or understanding, and/or skills). The second is the action taken by the learner to close that gap in order to attain the desired goal.”(p.11)
Teachers and facilitators play an equally important role with the learner in bringing about this sequence of events. For the first event to occur according to Black and Wiliam (1998),
“The prime responsibility for generating the information may lie with the student in self-assessment or with another person, notably the teacher, who discerns and interprets the gap and communicates a message about it to the student. Whatever the procedures by which the assessment message is generated, in relation to action taken by the learner it would be a mistake to regard the student as the passive recipient of a call to action. There are complex links between the way the message is received, the way in which that perception motivates a selection amongst different courses of action, and the learning activity which may or may not follow.”(as cited in Nichols and Dawson, 2012, p. 466)
Nichols and Dawson (2012) observe that formative assessment processes emphasizing engagement related approaches like self-reflection and self-determination are more effective than summative assessment practices in promoting persistence and academic achievement.
Others have shown that formative assessment practices provide students with greater opportunities to demonstrate autonomy and choice through feedback processes that are more informational than controlling which enhance engagement related actions and beliefs. (Deci & Ryan. 1995; Grolnick & Ryan, 1987)
Research shows formative assessment approaches to be a valuable context for the engagement of youth both cognitively and psychologically in self-regulation that leads to the exercise of student will or volition essential for “buy-in”. (Nichols & Dawson, 2012)
Manno, Yang, and Bangster (2015), in their work on engaging disconnected young people in education and work, state that “support from case managers and other adult staff seem to help promote youth engagement.”(p. iii) Dawes (2008) in her study of engaging adolescents in youth programs, found that leaders facilitate engagement by fostering a welcoming interpersonal climate, ensuring that serious activities are balanced with fun experiences and providing youth with verbal encouragement and strategic assistance on their projects. This research suggests that formative assessment can be a powerful connector, especially when placed in the hands of engaging case managers and program leaders.
WIOA research has focused on program performance with discussions of topics such as the importance of the employer network, career demand, issues of program integration, curriculum, and process. Until recently studies have focused on what is “done to” the participant and rarely on what is “done with them” or what “they thought or felt about” the program or their engagement. Essentially the focus has been on the process. Research rarely has examined if the process works or engages participants.
Method
While empirical impact studies provide, valuable results regarding program efficacy they offer little understanding of why a program works or how it achieves the desired result. This study builds on the qualitative research of Dawes & Larson (2011) who examined the narrative statements of 44 youth across 10 youth programs to develop a grounded theory of youth engagement. This study seeks to understand how and why the City of Los Angeles YouthSource Assessment Experience positively impacts WIOA youth performance rates.
Every participant in an InnerSight Assessment Experience is asked to complete an evaluation. The evaluation consists of 10 structured questions which participants may rate from strongly disagree to strongly agree. These questions are followed by three open ended questions that offer narrative content for analysis in this study.
What did you like most about the Experience?
What would you change about the Experience?
What additional comments do you have?
A copy of the evaluation form can be found in Appendix A.
Study Population: The study population consists of youth participating in the City of Los Angeles YouthSource program in 2014-15 at one of 13 provider sites across the City. A total of 899 individual evaluations were completed by youth participating in 68 InnerSight Assessment Experience sessions.
Information for gender and ethnicity of participants was not available in the data extract The City of Los Angeles provided total program gender and ethnicity information for program year 2014-15 reflecting a robust and diverse population of participating youth. For 2014-15 there were 1947 females (54.4%), 1630 males (45.6%). The reported ethnic makeup as expected is very diverse with the largest reporting group being Hispanic or Latino followed by White and African American/Black. The mix of Race or Ethnicity in the population is so large that participants are permitted to select more than one race or ethnicity, suggesting that the standard race identification categories are rapidly becoming ineffective demographic descriptors as study variables for this population.
Qualitative Analysis: Considering the significant impact the InnerSight Assessment Experience has been shown to have on WIOA outcomes, it would be helpful to understand how youth perceive the InnerSight Assessment Experience. To gain such an understanding, the narrative evaluation comments provided by youth in response to the three open ended questions on InnerSight Assessment Experience evaluations were examined to learn what they thought and felt about the Experience. A total of 1539 youth evaluation comments were obtained from 899 youth evaluations of the InnerSight Assessment Experience Sessions in the City of Los Angeles in program year 2014-15. These evaluative comments were collected from three open ended questions as noted above and in Appendix A.
Key word content analysis was used to organize responses to each question. Individual responses were grouped by their key word to identify meaningful content categories. Content categories for each question were then developed. The results for each category were examined and the number of responses for each recorded. Categories with 20 or more statements, or 5% or more of the responses, were considered major content or topical areas. Content areas with fewer than 20, or less than 5% of the responses, were collapsed under other observations.
Results of this content organization were examined by evaluation question to understand what participating youth felt about the Assessment Experience and why it worked for them.
Results
Results of the content analysis of participants’ responses to the three open-ended evaluation questions are presented by question below.
Most Like About the Experience
Responding to the question what they liked best about the Experience, the youth provided some 791 statements. These statements suggested eight major content categories of 20 or more statements. The remaining topics with 19 or fewer statements are reported as other observations and consist of some 142 statements in 13 topical areas. The number and percent of statements in each of the major content categories are identified in Table 1. Participants’ statements by question, content category and subcategory, where appropriate, can be found at: https://www.myinnersight.com.
Table #1
Summary of Participant Statements by Category
What Did You Like Most About the Experience?
| Content Category | Number of Statements | Percent of Total statements |
| Myself | 182 | 23.01% |
| Career Options | 175 | 22.12% |
| The Presenters | 80 | 10.11% |
| What I Learned | 73 | 9.23% |
| Validation/Confirmation | 43 | 5.44% |
| The Information Provided | 37 | 4.68% |
| The Booklet | 36 | 4.55% |
| Helpful | 23 | 2.91% |
| Other Observations* | 142 | 17.95% |
| Total | 791 | 100% |
| *Other Observations includes 13 categories | ||
Examining the statements provided by category offers insight into how the InnerSight Assessment Experience resonated with the youth and what was most important to them.
Myself – 182 (23.01%) of participants’ statements included the word “myself” and was the largest category expressing what they liked about the Experience. Simply stated they like that it focuses on them.
“What I liked most about this innersight was being able to learn more about myself and what I want to major in.”
” A great experience of discovering myself. I learned a lot of things about myself I didn’t know before.”
“What I liked the most was that I learned new things about myself that I would’ve never thought I had in me.”
“I enjoyed learning about myself.”
“I learned some reassuring things about myself.”
Career Options – 175 (22.12%) statements mentioned “career” and was the second largest category of expressions of what youth liked about the Experience. Participants said:
“It opened my eyes to all of my available job opportunities. I loved this.”
“I was able to become much more open minded to the career of interest. I found out a few careers that were never on my mindset. Interesting.”
“InnerSight was an amazing experience for me. It helped me figure out what career path to take and reassured me on what I like to do.”
“That it not only gave you careers but also college courses you could take and it gave you an idea of what you would be doing in the work fields.”
“I most liked, that I was given ideas about what to do with my future.”
These statements suggest participants gained insight regarding their future. They not only identified careers of interest, but found some they had never considered and now wanted to explore further. They began to see what they might need to study to pursue a career as well as what it might be like to work in the career field. They consistently enjoyed having new ideas regarding options that would be of interest in their future suggesting a developing intrinsic motivation.
The Presenters – 80 (10.11%) of the statements related to the presenters, or certified InnerSight Guides, who facilitate the Assessment Experience sessions. Participants shared the following:
“I loved the communication and even though it was a large group, the topics and session as a whole was very personalized. The presenters were very helpful, friendly and genuine.”
“I liked the fact that the speaker was very outspoken and listened to what we (students) had to say. Very polite! ?”
“Everyone got to share their dreams and goals, good examples and narrow down our requirements.”
“I liked how he interacted with us and got us to participate. Didn’t have a monotone and made it interesting.”
“It was easy to understand and personalized to meet my needs.”
“1 chill instructor.”
“The presenter was really nice.”
These reflections emphasize as noted in the literature the importance of connecting with the youth in both a personal and professional manner.
What I Learned – 73 statements or 9.23% focused on what youth felt they learned.
Youth said:
“I realized I need some work experience.”
“I learned different potentials that I have.”
“I’m very indecisive but need to expand horizon.”
“I liked most the learning experience and how well everything was explained.”
This again suggests that participants are building an intrinsic connection as they learn about who they are. These statements imply a discovery of the gap between where they are and where they might like to go.
Validation/Confirmation – Participants like receiving validation/confirmation as 43 (5.44%) of the statements touched on these ideas. For example, some participants said the following:
“I liked getting validation of my career choice. InnerSight also gave the many other choices that I would be interested in.”
“I liked seeing confirmation of my career and seeing all the other options that fit me.”
“Positive vibes, it got in touch with the inner me, and reassurance of my goal/path.”
Participants shared how satisfying it is to receive validation and confirmation of their personal goals and career paths. They also liked seeing other options that are a good fit with their already validated choices and interests.
The Information Provided – 37 responses (4.68%) relate to the Information received by the participants in the Assessment Experience sessions. Participants’ comments included the following:
“I liked that it was descriptive and full [of] information and gave me a lot of clarity.”
“I liked the useful information given by the presenters, it was very helpful.”
“All the various information will help me, help my community, friends and family. The money I make will not only be for me, but will be donated to give back.”
“I liked that it was very interesting and informative.”
“The amazing and helpful information given to me.”
“I liked that it was very interesting and informative.”
“Gave good information on what I wanna do.”
“The collected data/statistics.”
These observations suggest that the new information participants gain while learning about themselves is an important part of the Experience. They expressed amazement in finding fit between the information and their personal desires.
The Booklet – Some 37 responses (4.55%) pertained to the InSight Guide booklet provided to each participant. This is what several participants had to say
“I liked the booklet, it contains really useful information that can be used along our educational paths, job hunting, and to see our preferences and interests.”
“I loved how the booklet broke down what to do after you know what career path.”
“What I liked most was that we received a booklet of ourselves for ourselves.”
“I like the most about innersight was the book because it had the info that was so me.”
“The take home booklet plus the emailed file.”
Participants indicated that they like the InSight Guide booklet but, clearly it was because it focused on them and was all about them. Most importantly, after the Assessment Experience and work with their case managers, it contains their conclusions about their next steps or career pathways.
Helpful – Some 23 responses (2.91%) addressed the helpfulness of the Assessment Experience session. Participants found the Experience helpful. They wrote:
“Eye opener”
“It showed me what I could become and do”.
“It is very helpful.”
“Helped figure out more about me and careers.”
“They helped us learn more what we needed to learn.”
Participants indicated the Experience was helpful in seeing and realizing who they are, suggesting it was much like a personal epiphany.
Other Observations – There were 13 additional topics containing fewer than 20 statements each offering insight into what participants liked best about the Experience. These additional 142 statements make up 17.95% of the total observations of what participants like about the Experience. The 13 topics include: personalization, presentation, everything, participation aspects of the experience, easy to understand, specific things participants liked, accurate information, options/opportunities, interview skills, interests, participant interaction, fun and interactive, and activities.
Personalization of the Experience was noted in some 19 responses. This also speaks to the idea that it is all “about them”. Participants shared:
“I like how it all felt very personal and helped many different people.”
“That it involved my interests and not just common jobs that everyone likes.”
“I like the way that it was designed just for me with all my interests.”
“It was easy to understand and personalized to meet my needs.”
“I liked that they focused on everyone at the same time but also on everyone individually.”
“The individualized support.”
Some 18 statements touched on the presentation itself. Many participants liked the way the information in the Assessment Experience session was presented, as evidenced by the following statements:
“The fact that it was a key to open a door.”
“I love how the whole process is, from answering about 300 questions on that survey and then coming here to read about what that says about you is pretty awesome.”
“I liked the comforting and accepting atmosphere created.”
“The presentation was fun and engaging.”
These statements suggest that the formative process of presenting the information to participants in the Assessment Experience session is important. The interpretative approach appears to be effective and resonates with participants.
Participation in The Experience and that it was Easy to Understand each received 15 observations. Participants shared the following about their engagement and how easy it was to comprehend:
“I liked that we all got an opportunity to express our thoughts.”
“I liked how I felt comfortable and safe to say what’s on my mind”
“I enjoyed how everyone participated in the experience.”
“I liked how we all got to express our self in what we are.”
“The hands on experience.”
“That we shared our thoughts.”
“I liked that we talked about how it’s all up to me how we think.”
“What I like most about this experience was how easy it was to understand and how much information was provided.”
“Very clear.”
“How understandable it was.”
“Everything was clear and organized despite the fact that we jumped around in the booklet.”
“I like most about the Experience that it was clear and was really about me!”
“I clearly understood the booklet and results.”
“Easy to understand.”
These observations identify characteristics of the Assessment Session Experience. Participants appreciate the clarity, as well as the autonomy of choice and self-determination, in the Experience.
Thirteen observations touched on specific things participants liked about the Assessment Session Experience while 11 addressed the accuracy of the information. Participants shared that they liked things such as:
“The discussion”
“The paragraph”
“The communication.”
“I liked that it listed the skills I had.”
“It has statistics.”
“The power point”
“My results”
Participants also shared their thoughts on the accuracy of the information provided:
“The inventory results were very accurate, helped me learn more about my career and I’m 100% sure that physical therapy is what I want to do.”
“I like that it was well organized and it was very accurate on my interests.”
Ten statements touched on the options and opportunities participants learned about/ while six noted they gained new interview skills and six more felt their interests were clarified. These statements included observations such as:
“The information and the vast amount of opportunities for me.”
“I think I’m more prepared to talk to employers.”
“That the guides helped prepare me for interviews.”
“I learned what to say in an interview and financial support”
“It helps with my options.”
The final three topics in the other observation category included 6 statements about participant Interaction, 4 statements that the Assessment Experience was Fun and Interactive, and 2 regarding Activities.
“Hearing other’s opinions”
“That I got to conversate with different people and that we all shared something
about each other.”
“That we got to hear each other’s ideas.”
“It was really fun, I knew things I never heard about before!”
“It was entertaining and straight to the point.”
These statements suggest that the participants see the Assessment Experience as more than one dimensional. It appears to engage youth and allow them to use the information provided to self-validate their potential educational and career pathways.
What Would You Change
In commenting on what they would change about the Experience, the youth offered some 404 observations in six content areas. The content areas and associated percentage of responses in each are identified in Table 2. Content areas with less than 4% of the responses are reported under other observations. Some ten topics are covered under other observations.
Table #2
Summary of Participant Statements by Category toWhat Would You Change About the Experience?
| Content Category | Number of Statements | Percent of Total Statements |
| Nothing | 247 | 61.14% |
| Time | 43 | 10.64% |
| The Presentation | 20 | 4.95% |
| My Personal Thinking | 18 | 4.46% |
| Other Observations* | 76 | 18.81% |
| Total | 404 | 100% |
| *other observations include 10 topics | ||
Nothing – Participants indicated in 247 statements (61.14%) that they would change nothing in the Assessment Experience indicating a high level of satisfaction with the Experience.
Time – The Assessment Experience Session requires three hours of personal engagement. Feedback on time represented 10.64% or 43 of the What [I] Would Change responses. Twenty-two of the participants wanted it shorter, 16 were unclear, 3 wanted it longer and 2 wanted it at a different time of day.
Participants’ suggestions regarding time included:
“I would change the time. It was a long presentation.”
“I would try to shorten the time.”
“Nothing. It was good. Maybe less hours. But good.”
“I would change the time, 3pm felt a little late for me.”
“Turn it into a 2-day class.”
The Presentation – Twenty statements (4.95%) touched on the presentation suggesting changes that might be considered. Participants shared:
“Making the experience more individual in order to make it clearer.”
“It would be awesome if we could have a one-on-one meeting.”
My Personal Thinking – There were some 18 observations (4.46%) regarding how the Assessment Experience changed participants’ personal thinking. Participants said;
“I would recommend my friends at UCLA and bring them to the program.
“I would have loved to more about InnerSight. I felt I came in blindly and would have never expected this to truly help.”
“I would like to change that I thought I wouldn’t like it, but I did.”
“I would change my attitude about the experience.”
“The only thing I would change would be to try and participate more.”
“The only thing that I would change is my major.”
“I should have taken the survey more serious and spent more time on it.”
Other Observations – A total of 76 statements (18.81%) fell into 10 categories touching on topics such as games or interaction, boring, inventory and results, facilities, Assessment Experience environment, food, and breaks.
Several participants wanted more interaction or games as part of the presentation. A few felt that more information or having more people present would enhance the Experience.
“Maybe more activities; involve or incorporate some physical or active interactions.”
“More interactiveness with the other students.”
“Go even more in depth, with like education-wise.”
“Have more people attend.”
Only 4 commented on the session being Boring saying:
“More interaction, just sitting down was kind of boring.”
“I would add more excitement “.
Others stated the following about the Inventory and Results:
“What I would change is maybe the answers I gave to some questions.”
“I would want to take the quiz again and strongly agree on more topics.”
Some 29 statements focused on the facilities and environment for the Assessment Experience.
Room temperature and facilities received the most mention with statements such as:
“I would change the room temperature, it was a little cold.”
“Turn the AC on.”
Food and the break were also noted by participants:
“Add some snacks.”
“I would eat before coming. I was hungry.”
“That we could get two breaks.”
Additional Comments
When offered the opportunity to share additional comments, participants offered 344 observations in 5 major content areas. The content areas and associated percentage of responses in each are provided in Table 3. Content areas with less than 5% of total responses are combined in other observations and cover 6 topic areas.
Table #3
Summary of Participant Statements by Category toWhat Additional Comments Do You Have?
| Content Category | Number of Statements | Percent of Total Statements |
| The Experience | 139 | 40.41% |
| Thank You | 52 | 15.12% |
| The Presenters | 47 | 13.66% |
| Useful or Helpful | 40 | 11.63% |
| The Presentation | 20 | 5.81% |
| Other Observations* | 46 | 13.37% |
| Total | 344 | 100% |
| *Other Observations includes 6 topics | ||
The Experience – The Assessment Experience session was the focus of 40.41% or 139 of the additional comments. Participants said:
“Extremely happy about InnerSight and the way it makes me feel about understanding myself.”
“I loved it.”
“This class was an amazing experience and I would love to do it again.”
“This was a long experience, but it was worth it.”
“Love it (heart)”
“InnerSight is such a great program and is valuable to anyone who takes it.”
“The InnerSight is a good way to let people know who they really are. InnerSight has helped me reveal myself. Thank you InnerSight
“It was legendary”
These observations suggest that, InnerSight offers personal value for the participant and contributes to building an understanding of self.
Thank You – Fifty-two observations (15.12%) simply made the effort to say, “thank You:”
“Thank you for a wonderful Saturday morning? It was worth it.”
“Just a thank you! I really appreciate you all taking the time to guide others in important aspects of life.”
The Presenters – Forty-seven additional observations (13.66%) touched on the presenters. Participants said:
“I like how friendly everyone was and how they encouraged us all to participate.”
“All my questions were answered and I was comfortable all the time.”
“Great job to the presenter not boring.”
“My additional comment is that it was entertaining to be part of a professional way to conduct a workshop.”
These comments highlight the importance of the quality of the interaction by engaging youth in both a respectful and professional manner.
Useful or Helpful – observations made up 40 (11.63%) of participant’s additional comments. In expressing the helpful nature of the InnerSight Assessment Experience, participants made the following comments:
“I’m looking forward to sharing what I learned today with my parents who are very interested in my occupations.”
“This session was helpful to me and it did help me reconsider my major and think about how I would use my major to help others.”
“This experience was great and helpful. Now, I have a better sense of what person I am.”
These statements suggest the personal value of the Assessment Experience in charting a future plan as well as in communicating with parents.
The Presentation – Twenty (5.81%) of the additional comments focused on the presentation. Participants shared:
“Maybe a video of the people that have had InnerSight help them and they can give feedback, suggestions and comments to the new InnerSight people.”
“Ask more questions to the clients, make them volunteer, have them come out of their shell to have a more active session.”
“The preference presentation is amazing and unique.”
“Overall it was a great presentation”
Other Observations – Include 46 responses (13.37%) covering some 10 additional topics such as; recommend to others, my future, environment, and food were shared by participants.
Eleven participants recommended that others should take part in the Assessment Experience offering statements such as:
“InnerSight is a great experience I would highly recommend it for incoming college students to get an idea on what career to choose.”
“I strongly recommend this to anyone because it’s a nice experience and you learn new things about yourself.”
Six responses focused on the participants’ future with statements like:
“I really like how InnerSight helps people in finding their majors or jobs for the future.”
“Through InnerSight I was able to see what kind of future I could have.”
The remaining statements were general in nature with four focusing on the environment expressing equal emphasis on temperature, facilities, and food with responses like the statements about environment reported under desired changes.
Discussion
The City of Los Angeles YouthSource program has implemented a developmental program element to actively engage youth in the preparation of individual service strategies as expected by WIOA. YouthSource partnered with InnerSight LLC to provide the InnerSight Assessment Experience as a foundational and integrating element for their program.
YouthSource views assessment as more than a test. Like Nichols and Dawson (2012) they view assessment as a powerful foundation and tool for personal growth and development. The key for YouthSource is youth engagement, which occurs when the youth use their self-understanding in charting educational and career pathways.
The literature is replete with studies (Hossain, 2015; Dawes & Larson, 2011; Nichols & Dawson, 2012) speaking to the importance of truly engaging the youth. The City of Los Angeles YouthSource program accomplishes this with the InnerSight Assessment Experience that serves as a common foundational program element across all service providers. Thus, the effective use of assessment becomes a common element in the development of individual service strategies across all programs.
The City recognized the key to success was not the assessment tool but the youth’s effective use of the information. They adopted the InnerSight Assessment Experience to provide an inventory, but most importantly, a three-hour interpretative Experience which fully engages the youth in self-validation of their preferences, interests and the careers they most prefer. When followed up with encouragement and strategic assistance by case managers, as Dawes (2008) suggests, the youth have a personal development plan grounded in who they are and what they most prefer.
Youth participating in the InnerSight Assessment Experience have significantly higher success rates on WIOA outcome measures (Perkins et. al, 2016 & Perkins et. al 2017). This suggests a powerful impact when Assessment outcomes are effectively used.
While these studies have provided empirical evidence of program impact on WIOA outcomes they offer little insight regarding how youth feel about the Experience and perhaps what makes it work. Building on the qualitative theoretical work of Dawes & Larson (2011) on how youth become engaged, this study examined some 1539 narrative statements from 899 youth participating in the InnerSight Assessment Experience to understand how and why it works for them.
The Results show that youth really like that the Assessment Experience is all about them. This is perhaps a powerful message about what happens when we “Put the Person in the Process”. This is consistent with motivational theory suggesting the activity must develop positive subjective feelings toward it (Hidi,2000), become integrated into self (Ryan & Deci, 2000), build a personal connection (Dawes & Larson, 2011), and connect to a future goal in a process described by Rickman (2009) as “finding fit”. It seems too much program time can be spent in activities needed to process the person rather than activating and engaging them in the process as suggested in the literature on youth engagement.
Youth observations across the three evaluative questions in this study provided important insights on youth perceptions and feelings regarding the Assessment Experience. Their narrative observations fell into 46 content categories across the three evaluation questions. Seven content areas received 50 or more responses and accounted for 948 or 61% of the narrative observations. For these seven content categories, the associated evaluation question and number of responses in the category are provided in Table 4 as a quick summary.
Table #4
Content Categories with 50 or more Responses by Evaluation Question
|
Content Category |
Number of Statements |
Evaluation Question |
|
Nothing |
247 |
What I would Change |
|
Myself |
182 |
What I Liked |
|
Career Options |
175 |
What I Liked |
|
The Experience |
139 |
Additional Comments |
|
The Presenters |
80 |
What I Liked |
|
What I learned |
73 |
What I Liked |
|
Thank You |
52 |
Additional Comments |
Connecting with youth participants is key to sustaining their engagement as noted by Manno (2015). Dawes & Larson (2011) state participants “need to not only attend but become psychologically engaged in program activities”. The number one content category, with 247 responses, was to ‘change nothing’ about the Assessment Experience suggesting a strong affinity for the Experience from today’s youth. But what is the most compelling or psychologically engaging for them?
The narrative statements suggest that when the Experience is all about them it becomes a powerful connector and “turning point” (Dawes & Larson, 2011). When it comes to career options it also was all about their options not just possibilities. These options connected the experience activity with participants’ potential future goals which is important in fostering engagement (Dawes & Larson, 2011).
In the additional comments, participants spoke of the Experience in terms of how it made them feel. The InnerSight session Guides were seen as positively contributing to the personal connection as well as how participants felt about the Experience. Learning about themselves and what they might need to consider in their life journey appears to also be a powerful connector as noted by Dawes and Larson (2011). While the Experience clearly focuses on the participants it connects in a manner that elicits participants’ appreciation.
So why does the InnerSight Assessment Experience achieve significant empirical gains in WIOA success rates? When we listen to the participating youth in this qualitative study it is because it connects. First as suggested by Nichols and Dawson (2012) the InnerSight Assessment Experience uses a formative approach that engages the participant. Second, as Dawes and Larson (2011) suggest for achieving engagement it connects both cognitively and psychologically by putting participants in the process of self-determination. Everything is about them, from the InSight Guide booklet to the professional interaction in the session, the cognitive content material is all about who they are and where they might go. The Experience is all about the participant and “the connect.”
When case managers support this connection using the InnerSight Assessment Experience material as the foundation for charting the youth’s pathway, it is an engaging and integrated program experience for the youth. As noted by Manno et. al (2015) this case manager support facilitates engagement. The youth is clearly in charge, working side by side with the case manager as a helpful facilitator.
The City of Los Angeles YouthSource program has focused on positive youth development by establishing a common program element across the City. This consistent program effort produces significant WIOA results. These program accomplishments have been realized by “Putting the Person in the Process”.
References
Black, P., & Wiliam, D. (1998). Assessment and classroom learning. Assessment in Education: Principles, Policy and Practice, 5(1), 7–74.
Csikszentmihalyi, M. (1975). Beyond boredom and anxiety: The experience of play in work and games. San Francisco, CA: Jossey-Bass.
Csikszentmihalyi, M., Rathunde, K., & Whalen, S. (1993). Talented teenagers: The roots of success and failure. Cambridge, England: Cambridge University Press.
Dawes, N. P. (2008). Engaging adolescents in organized youth programs: An analysis of individual and contextual factors (Unpublished doctoral dissertation).University of Illinois at Urbana-Champaign.
Dawes, N.P., Larson, R. (2011), How Youth Get Engaged: Grounded-theory research on motivational development in organized youth programs. Developmental Psychology, Vol 47(1), Jan 2011, pp 259-269.
Deci, E. L., & Ryan, R. M. (1995). Human autonomy: The basis for true self-esteem. In M. Kernis (Ed.), Efficacy, agency, and self-esteem (pp. 31–49). New York: Plenum Publishing Co.
Grolnick, W.S. & Ryan, R.M. (1987) Autonomy in Children’s learning: An experimental and individual different investigation. Journal of Personality and Social Psychology, 52, 890-898.
Hidi, S. (2000). An interest researcher’s perspective: The effects of extrinsic and intrinsic factors on motivation. In C. Sansone & J. M. Harackiewicz (Eds.), Intrinsic and extrinsic motivation: The search for optimal motivation and performance (pp. 311–339). San Diego, CA: Academic Press.
Hidi, S., & Renninger, K. A. (2006). The four-phase model of interest development. Educational Psychologist, 41, 111–127.
Hossain, Farhana (2015). Serving Out-of-School Youth Under the Workforce Innovation and Opportunity Act (2014). Retrieved from http://www.mdrc.org/publication/serving-out-school-youth-under-workforce-innovation-and-opportunity-act-2014
Kazis, Richard (2016). MDRC Research on Career Pathways. Retrieved from http://www.mdrc.org/publication/mdrc-research-career-pathways
Manno, M.S., Yang, E., Bangster, M. (Oct. 2015) Engaging Disconnected Young People in Education and Work. Retrieved from http://www.mdrc.org/sites/default/files/2015_Engaging_Disconnected_Young_People_FR.pdf
Meijers, F. (1998). The development of a career identity. International Journal for the Advancement of Counseling, 20, 191–207.
Moore, R. W., Gorman, P. C. (2009). The Impact of Training and Demographics in WIA Program Performance: A Statistical Analysis. Human Resource Development Quarterly, Vol 20(4), Winter 2009 pp.381-396.
Nichols, S. L., Dawson, H.S. (2012). Assessment as a Context for Student Engagement In, Christenson, S.L. (Ed.), Handbook of Research on Student Engagement (pp. 457-477), New York, NY, Springer Science+Business Media, LLC 2012.
O*NET OnLine. Retrieved from: https://www.onetonline.org/
Perkins, M.L., Reeves, J.E., Mancheno-Smoak, L., Furlong, D.K. (2016), Assessment Program Impact on Successful WIOA Program Performance in the City of Los Angeles YouthSource Program. Retrieved from https://www.myinnersight.com/impact-study-v2/
Perkins, M.L., Reeves, J.E., Furlong, D.K. (2017), Assessment Program Impact Increases WIOA Performance in the City of Los Angeles YouthSource Program: A Replication. Retrieved from https://www.myinnersight.com/
Rickman, A. N. (2009). A challenge to the notion of youth passivity: Adolescents’ development of career direction through youth programs (Unpublished master’s equivalency paper). University of Illinois at Urbana–Champaign.
Ryan, R. M., & Deci, E. L. (2000). Self-determination theory and the facilitation of intrinsic motivation, social development, and well-being. American Psychologist, 55, 68–78.
Schneider, B., & Stevenson, H. (1999). The ambitious generation: America’s teenagers, motivated but directionless. New Haven, CT: Yale University Press.
United States Department of Labor, Employment and Training Administration (2015). Retrieved from https://www.doleta.gov/performance/guidance/laws_regs.cfm
Appendix A

InnerSight Experience Evaluation
Date
Session Name and Time
Print Name:______________________________
For each statement below, please circle how strongly you agree or disagree with the statement.
1=Strongly Disagree(SD) 2=Disagree(D) 3=Neutral(N) 4=Agree(A) 5=Strongly Agree(SA)
| SD | D | N | A | SA | |
| 1. The information given was easy to understand. | 1 | 2 | 3 | 4 | 5 |
| 2. The PowerPoint presentation was clear and enhanced the presentation. | 1 | 2 | 3 | 4 | 5 |
| 3. The room temperature, lighting, and seating were comfortable. | 1 | 2 | 3 | 4 | 5 |
| 4. I was able to hear and see both the presenters and the other participants. | 1 | 2 | 3 | 4 | 5 |
| 5. Overall, this session was of value to me. | 1 | 2 | 3 | 4 | 5 |
| 6. This session met or exceeded my expectations. | 1 | 2 | 3 | 4 | 5 |
| 7. My inventory results made sense and sounded like me. | 1 | 2 | 3 | 4 | 5 |
| 8. My InSight Guide Booklet is of high quality. | 1 | 2 | 3 | 4 | 5 |
| 9. I felt the presenters listened to me and to the other participants. | 1 | 2 | 3 | 4 | 5 |
| 10. I would recommend the InnerSight Experience to my family and friends. | 1 | 2 | 3 | 4 | 5 |
What did you like most about the Experience?
What would you change about the Experience?
What additional comments do you have?
I give InnerSight permission to use my name, any part or all of my recorded or written statements, any or all of my recorded actions, and my likeness for training marketing and advertising, and commercial project(s) in whatever various media forms InnerSight may choose for the development and distribution of the project(s) and the works coming out of the project(s). I am not receiving any compensation for this permission and forever waive any rights to compensation. I am at least eighteen years of age.
Signature:_________________________ Date_____________________________
Do City of Los Angeles Youth who have InnerSight Perform Better on WIOA Outcomes?
Overview
Connecting Out of School Youth Preferences to Career Plans Impacts YouthSource Program Performance
The City of Los Angeles Economic and Workforce Development Department’s YouthSource program is a premier provider of service for in and out-of-school youth. The city serves some 17,000 youth in its annual and summer programs. The Los Angeles YouthSource program has been nationally acclaimed by the Department of Labor for its progressive commitment to serving out-of-school youth. In 2012 before the new WIOA requirements, the City made a substantial commitment to serving this population requiring 70% of the youth served at its 13 YouthSource sites be out-of-school youth. As a result, they have become the nation’s most successful program in addressing the needs of this underserved population.
In 2012 the YouthSource program implemented the InnerSight Assessment Experience to:
- Actively engage participants in the development of their individual plan.
- Provide caseworkers with a foundation for development of individual plans grounded in participant’s assessment results.
- Connect individual plans and strategies to specific educational, training and occupational goals.
- Help caseworkers and clients see those skills needed to achieve occupational fit.
- Provide documentation of participant and case manager mutual engagement and results oriented planning.
A recently released study “Assessment Program Impact on Successful WIOA Program Performance in the City of Los Angeles YouthSource Program” shows that out-of-school youth participating in the City’s InnerSight Assessment Experience achieve the educational attainment outcome measure at a significantly greater rate. Forty-three percent (43%) of the out-of-school youth who have the assessment experience achieve the attainment goal for a statistically significant 14% improvement over the 29% attainment rate of those without the experience.
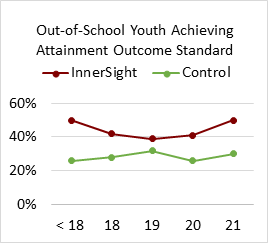
The study also revealed a 48% success rate in achieving the literacy standard for youth participating in the InnerSight Assessment Experience versus a 42% success rate for nonparticipants. Findings indicate success rates for the WIOA critical population of out-of-school youth who complete the InnerSight Assessment Experience are significantly higher than their peers on the Attainment and Literacy performance measures.
The City selected this assessment program to help WIOA staff align youth and adults with education, training programs, internships, and actual job openings that are a best fit for them. The findings affirm that when interests and preferences are aligned and self-validated by the individual, their success rate increases.
Through the InnerSight Assessment Experience, youth come to see they are the “Key” to their personal, educational, and career training choices and gain important information about themselves to reflect upon when making those choices. After self-validating their personal interests and preferences for working, learning, leading, risk taking, and team orientation, participants are equipped to explore occupations of people who are satisfied in various occupations and share the participants’ interests.
When asked what they liked most about the Experience youth say, “Keep up the work. There are many people out there like me who are lost and not sure what to do. But with this book and your help, there are paths that seem to open & lighten up.” and “This experience helped me get a clearer understanding of what I would like in my future career and I learned a lot about myself.”
Knowing Who You Are… Is the First Step …In Knowing Where You Are Going!
Full Study
Assessment Program Impact on Successful WIOA Program Performance in the City of Los Angeles YouthSource Program
Mark L. Perkins, John E. Reeves, Lolita Mancheno-Smoak, Debora K. Furlong
Abstract
The Workforce Innovation and Opportunity Act (WIOA) measures labor market outcomes as indicators of program performance. This article uses statistical analysis to examine the impact of the InnerSight Assessment Experience on the rate of performance on key outcome measures in the City of Los Angeles YouthSource Program. The findings suggest that the InnerSight Assessment Experience has a positive impact on youth performance on the WIOA performance measures of Attainment and Literacy. The impact is most profound for out-of-school youth, the target service population under WIOA. Implications and considerations for policy makers and future research are provided.
Purpose
The City of Los Angeles Economic Workforce Development Department (EWDD) offers the InnerSight Experience as a consistent program element across its 13 YouthSource service sites. This study examines the impact of this common program element on youth development as indicated by performance on Workforce Innovation and Opportunity Act (WIOA) performance measures of placement, literacy and attainment.
Introduction
The city of Los Angeles YouthSource program is a premier provider of service for in and out-of-school youth. The city serves some 17,000 youth in its annual and summer programs. The Los Angeles YouthSource program has been nationally acclaimed by the Department of Labor for its progressive commitment to serving out-of-school youth. In 2012 before the new WIOA service requirements, the City made a substantial commitment to serving this population when it required that 70% of the youth served at its 13 YouthSource sites be out-of-school youth. As a result, they have become the nation’s most successful program in addressing the needs of this underserved population.
YouthSource program leadership desired to offer a consistent program element to serve youth across its 13 sites. Most importantly they wanted a program element that is developmental for each participant while meeting WIOA expectations and requirements. Specifically, they were seeking a program that would accomplish the following:
- Actively engage participants in the development of their individual plan.
- Provide caseworkers with a foundation for development of individual plans grounded in participant’s assessment results.
- Connect individual plans and strategies to specific educational, training and occupational goals.
- Help caseworkers and clients see those skills needed to achieve occupational fit.
- Provide documentation of participant and case manager mutual engagement and results oriented planning.
They believe a program grounded in participant personal development that connects youth with high demand occupations using their preferences and interests will facilitate persistence in the attainment of educational, training and career goals. To accomplish this, the city issued an RFP and selected the InnerSight Assessment Experience to meet this unique program and developmental objective.
The InnerSight ExperienceTM
The InnerSight Assessment Experience consists of three important steps. First, participants take an online inventory to provide information to clarify their interests and preferences. Second, they participate in a self-validating group interpretation of the inventory known as the InnerSight Experience™. Third, participants share their results with their case managers and lay out the steps in their individual service plan.
The InnerSight Experience gives participants a vocabulary, context, and framework for bringing their personal interests and preferences to bear on life’s choices. This experience puts the “Power of the Person” in the decision-making processes of life. Through the Experience, participants come to see they are the “Key” to their personal, educational, and career training choices and gain important information about themselves upon which to reflect when making those choices.
The InnerSight Experience is collaborative and delivered in a group setting. This interactive experience engages participants in both individual and group exercises that emphasize and highlight the distinctiveness of their personal results.
The InnerSight Assessment Experience consists of an online interest and preference inventory resulting in a personalized InSight Guide® booklet which is the foundation for a 3-hour, in person, group interpretative experience. By self-validating their personal interests and preferences for working, learning, leading, risk-taking, and team orientation, participants are equipped to explore occupations of people who are satisfied in various occupations and share the participants’ interests.
Participants learn that individuals are typically employed for what they know and terminated for what they do or fail to do. When interests and preferences are aligned with an occupation (work tasks), satisfaction, happiness, and superior performance occur. Youth with cultural, familial, and economic barriers are no exception. When engaged in subjects of interest (music, dance, skateboarding, etc.), individuals succeed.
The InnerSight Experience™ is grounded in the prolific research and universally acclaimed Work Types Model of the eminent vocational psychologist Dr. John Holland. The Holland Model was adopted by the Department of Labor as the foundation for their online career exploration system O*NET. This system can be directly accessed from the electronic Insight Guide booklet participants receive after completing the InnerSight Experience by simply clicking on a preferred occupation.
For over 75 years, interests and preferences have been known as key factors in motivation for continued effort. First used in World War I to determine which men might prefer to be cooks or which might prefer to be in the cavalry, interests have proven to be an effective method of determining continued effort/success in education, career, and personal life. Using interests and preferences to help individuals make better life choices is a time-tested and valid approach.
InnerSight uses this approach, but has changed the traditional career assessment/exploration model. Youth are accustomed to being processed, asked what they know (education), or told what they need to know and do next. InnerSight begins the journey by first exploring and having participants validate what they may like or enjoy doing. Additional exercises guide the participants to discover the connection between what they enjoy doing and potential occupations in which people who share their interests are satisfied.
The InnerSight Assessment Experience continues when participants meet with their case managers to begin Next Steps planning in the InSight Guide booklet based on their self-validated results. Case managers who work with the youth complete the InnerSight Experience and training in “Facilitating the Journey”. “Facilitating the Journey” training provides case managers with the simple skills needed to engage the participant in a meaningful discussion of their results and use them as the foundation of the individual service plan.
Each InnerSight Experience session is evaluated by the participants. Their ratings provide continuous feedback on characteristics of the Experience from the InSight Guide booklet to facilities and the accuracy of their results. In addition, they are asked to respond to three open-ended questions regarding what they liked, what they would change, and any additional thoughts. These personal responses provide a rich source of qualitative information for understanding in participants’ words how they were impacted by the Experience.
The InnerSight Assessment Experience is designed to help WIOA staff align youth and adults with education, training programs, internships, and actual job openings that are a best fit for them. This study now examines the impact of the InnerSight Experience on WIOA performance measures.
Literature
The literature is replete with studies and meta-analyses of workforce investment program performance. It has long been the interest of policymakers for job-training programs to be evaluated using tangible labor market results for participants. King (2004) notes the Department of Labor has funded a host of studies in recent decades to assess the impact of training programs using such measures.
Moore and Gorman (2009) observed; “Policymakers brought this focus on performance to the creation of the Workforce Investment Act (WIA) in 1998. WIA, which replaced the Job Training Partnership Act (JTPA), established 17 performance measures to drive program performance.” They go on to observe that most of the 17 metrics were for labor market outcome indicators, such as changes in participant earnings, rate at which participants are placed in jobs, etc.
Social Policy Research Associates (2004) in an early assessment of WIA implementation noted that the 17 measures made sense to program operators but concluded that some operators felt definitions were vague and perhaps there were too many. As WIA evolved, the Federal Department of Labor elected to move to a new measurement system consisting of fewer labor market outcomes known as “common measures”. Dunham, Mack, Salzman and Wiegand (2006) note that these “common measures were to be implemented for adults beginning in Program Year (PY) 2005, which began July 1, 2005, and for youth in PY 2006 (beginning July 1, 2006)”. (pg.22)
While there is a plethora of publicly available performance data, Moore and Gorman (2009) observe “there is little in depth analysis of the performance of the WIA system or of the likely drivers of the new common measures. Specifically, there has been little published on the relationship between individual participant characteristics and the program performance measures.” In fact, the Moore and Gorman, 2009 study on the impact of training and demographics in WIA program performance is the first we could find examining how the characteristics of participants may or may not influence the outcomes measured.
As might be expected they found demographic characteristics such as age, ethnicity, education etc. account for considerable variance in performance outcomes. These findings led Moore and Gorman to the following policy and program conclusions:
“A system of adjusting performance standards for states, local areas, and agencies that serve more disadvantaged populations is rational and would make good public policy.” (p. 393)
“Policymakers should track whether or not the demographics of participants shift away from the most disadvantaged as the WIA-mandated outcome measures change to the new universal performance measures……. One-Stop operators and local area WIBs both have incentive to perform well on the outcome measures, and when outcome measures can be affected simply by adjusting the demographic profile of those served, it would not be surprising if One-Stops and local area WIBs were to shift their resources toward serving those more likely to help improve their outcome measures, rather than those most in need.” (p. 393)
“Data suggest relatively long-term and more expensive training services are not uniformly superior to shorter-term, less costly interventions such as job search assistance and one on one coaching and counseling.” (p. 393)
“No positive impact was found for any form of training on adult WIA participants… This does not mean that participants never benefit from training, but rather that the training intervention needs to be carefully targeted both toward individuals who can benefit from training and toward skills that are demanded by the local labor market. Simply loading WIA participants into available skill training without an individual strategy for each participant is not likely to yield positive outcomes. For dislocated workers, occupational skills training appeared to have a strong positive effect on earnings, and other forms of training were associated with lower earnings. These findings need to be considered by practitioners as they design interventions for individual participants.” (p. 394)
Moore and Gorman identify the profound impact of demographics on WIA performance measures. They go further suggesting “there is a need for researchers to undertake more nuanced studies of the connections between training and labor market outcomes in WIA, with carefully controlled studies to identify the types of participants and types of training most likely to lead to successful outcomes.” (p. 394) This suggests a need for providers to understand what program elements, assessments, or experiences have a positive impact on participant’s performance on the common WIA metrics.
Borden (2009), in a comprehensive article on the challenges of measuring employment program performance, says “research on employment and training programs focuses primarily on evaluations of the impact of public investment in job-training services”. (p. 2) He goes on to suggest that there is indeed a dichotomy between the program management objectives of performance management and its evaluative objectives. Moore and Gorman focused on the impact of demographic characteristics and their relationship to the achievement of performance measures. This study goes a step further by analyzing the impact of program on the successful achievement of desired performance outcomes and to identify those elements that drive desired job training performance.
Barrow and Smith (2004) clearly suggest that program evaluation and performance management derive from different sources and motives and have deeply committed adherents. The question is not whether we should track or measure program performance but rather how do program elements contribute to the achievement of job-training and employment program objectives. As suggested by Borden (2009), “there is an increasing tendency to leverage the efficiency of analyzing administrative data versus more expensive experimental designs”. (p. 5) The truth is both are needed, but the experimental designs with appropriate stratified samples of participants for randomization with clean and accurate participant data are not only more expensive, but practically impossible to achieve. Thus, impact studies with limitations may be the most informative indicators of positively contributing program elements for achieving job-training program results. Most importantly, as suggested by Borden, a good measure must produce a rate of success and not simply a count of activities.
Borden properly points out that “we must distinguish clearly between service delivery and program management. Performance management systems track common events such as enrollment date, customer characteristics, limited service dates, exit date, and outcomes. Performance management systems do not specify how services are delivered.” (p. 21) nor do they indicate how services impact performance management outcomes. While it is impossible to design measures that account for all factors bearing on the success with a single customer, focused impact studies can be helpful in determining a program or assessment’s potential accountability for or contribution to program outcomes. With clear program performance measures in place we can begin the analysis of those processes and methods that produce the best results for program participants.
The first major update in almost 15 years to the Workforce Investment Act of 1998 (WIA) was signed into law in 2014. The new federal Workforce Innovation and Opportunity Act (WIOA) places greater emphasis on serving out-of-school youth (75% versus 30% under WIA). WIOA defines out-of-school youth as 16 to 24-year-olds who are not attending any school and who have one or more barriers to employment, such as young people who are homeless, are parenting, have disabilities, or have a juvenile criminal record (United States Department of Labor, Employment and Training Administration (2015)). The new law requires states and localities to develop strategies and programs for recruiting and serving more of these young people than ever before.
This could be a daunting task. Hossain (2015) observes that “while a majority of the out-of-school youth seek out opportunities to connect training and work, youth programs often report difficulties in sustaining participation after the initial connection is made. WIOA-funded service providers will not only have to reach more out-of-school youth, they will also need strategies to stimulate sustained, intense engagement in services.” (p. 1) She goes on to observe that “few programs target the young people who are the most persistently disconnected, and there’s not much evidence on what works in engaging them.” (p. 3) Perhaps most importantly she says that “a significant share of out-of-school youth do not enroll in education and training programs because they have been alienated from mainstream institutions, like schools and social welfare agencies, due to earlier negative experiences. New strategies to reach and engage alienated and disaffected young people should be a priority.” (p. 3)
Hossain (2015) suggests programs “have to find a balance between allowing vulnerable young adults some flexibility in regard to program requirements… while developing processes and practices that allow young people to develop autonomy and leadership” (p. 4). Specifically, she recommends “asking young people for their input in designing program activities and allowing them to have a voice in program governance.” (p. 4)
WIOA encourages implementation of career pathway approaches that will support post-secondary education and training for out-of-school youth that is related to the demand for qualified workers in local labor markets. The individualized pathway is to be grounded in an assessment of skills and interests that can inform the participants’ career decision-making while identifying logical short-term next steps consistent with long-range goals.
The US Departments of Education, Health and Human Services, and Labor issued a joint letter in 2012 that provided a common definition of career pathways that encompasses initiatives that begin with secondary or post-secondary education and credentials. According to the letter a career pathway approach is:
“…A series of connected education and training strategies and support services that enable individuals to secure industry relevant certification and obtain employment within an occupational area and to advance to higher levels of future education and employment in that area.”
Richard Kazis in a MDRC research brief on Career Pathways (2016) observes “there is little rigorous research that assesses the impact of comprehensive career pathways programs that follows individuals from different starting points through a coherent set of educational experiences and “stackable” credentials to the labor market.” (p. 2) His research brief however, goes on to note that there are components that are being studied that might help policymakers as well as program designers and managers. He provides brief summaries of project models that make a difference in several categories including high schools, out-of-school and disconnected youth, and low income adults. Kazis suggests there is a paucity of research on how to positively engage the participant in his/her personal development of a successful career pathway.
Research has primarily focused on program performance, yielding discussions on topics such as the importance of the employer network, career demand, and issues of program integration, curriculum and process. All of these focus on what is “done to” the participant and rarely on what is “done with them”. With the exception of Moore and Gorman who examined the impact of demographic characteristics on program performance measures there has been virtually no research examining the impact of program elements offered by providers on WIOA performance indicators. This study presents an analysis of a robust population of WIOA participants from a large diverse city exploring the relationship between the participant’s program assessment experience and subsequent performance on WIOA common measures.
Impact Analysis Approach
As noted by Moore and Gorman (2009) and Borden (2009), the gold standard random-assignment experimental design is extremely difficult and virtually cost prohibitive to use with live WIOA programs. This is perhaps why there is virtually no research on the impact of individual program elements on the common WIOA performance measures. As a result, program providers are left with little or no information regarding program elements that significantly impact participant performance on program performance indicators.
While this study might be referred to as a quasi-experimental design, the authors prefer to call it an impact analysis. This is a first step in identifying the impact of an assessment experience on participant’s achievement on WIOA outcome measures. Essentially, it would be helpful to know if the assessment experience significantly impacts youth performance on program outcome measures.
Method
Research Questions: This study analyzed youth participant performance on WIOA outcome measures for youth participating in the City of Los Angeles YouthSource program in program year 2014 – 2015 (PY-1415) to answer the following questions:
- Do youth participants who have the InnerSight Assessment Experience achieve satisfactory performance on the WIOA outcome measures of attainment, literacy and placement at a significantly greater rate than those who have not had the Experience?
- Do out-of-school youth participants who have the InnerSight Assessment Experience achieve satisfactory performance on the WIOA outcome measures of attainment, literacy and placement at a significantly greater rate than out-of-school youth who do not have the Experience?
Study Population: The study population consists of in-school and out-of-school youth participating in the City of Los Angeles YouthSource program at one of 13 provider sites across the City. Study participants are youth the City of Los Angeles included in the performance analysis for each of three WIOA performance outcome criteria for program year 2014–15. Performance of youth participants who have completed the InnerSight Assessment Experience (Experimental Group) is compared with those who did not complete the Experience (Control Group). The outcome performance measures for this study were drawn from the City of Los Angeles “Jobs LA” performance tracking system. The outcome measures for this study are described below.
Literacy– Literacy & Numeracy Gains
This indicator measures the increase by one or more educational functioning levels from out-of-school youth who are basic skills deficient within a one-year period of participating in program services.
Meeting the Standard: Youth meet the outcome standard for this measure if they:
- Show increase in skills as measured by the Comprehensive Adult Student Assessment System (CASAS) Life & Work (reading) and Life Skills (math) Series at program entry within one year of start of program services.
- Increase one educational function level (EFL) in math, reading or both, during each year of program participation.
Placement -Placement in Employment, Education, or Training
This indicator measures whether a participant is in an education or training program that leads to a recognized post-secondary credential or unsubsidized employment in 1st Quarter after program exit. This measure requires a quarterly follow up for one year after program exit
Meeting the Standard: Youth meet the outcome standard for this measure if they meet one of the following:
- Employed by an unsubsidized organization.
- Entered military service.
- Enrolled in a post-secondary education program.
- Enrolled in an advanced training or occupational skills training program.
Attainment -Credential Rate
This indicator measures the attainment of a high school diploma, GED, or certificate during program participation or by the end of the 1st Quarter after program exit.
Meeting the Standard: Youth meet the outcome standard for this measure if they meet one of the following:
- Receive a High School diploma certifying completion of a secondary school program of studies.
- Receive satisfactory scores on the General Education Development (GED) test.
- Receive a formal award certifying the satisfactory completion of an organized program of study at a post-secondary education program.
Table 1 provides demographic information for the InnerSight Assessment Experience and Control Groups for Program Year 2014-15. The average age for the three study groups ranges from 18.3 to 19.1 years. Since the cohort deemed appropriate for each individual outcome is different it’s helpful to understand the demographics for each outcome cohort as reflected in Table 1.
Literacy: The literacy outcome measure is appropriate only for out-of-school youth. Out of the total 1665 participants, 270 (16%) completed the InnerSight Assessment Experience while 1395 (84%) did not have the Experience.
Placement: The placement outcome measure was deemed appropriate for a total of 2085 youth participants of which 557 were in-school-youth (27%) and 1528 were out-of-school youth (73%). A total of 362 participants completed the InnerSight Assessment experience (17%) while 1723 in the control group did not have the Experience (83%).
Of the in-school youth, 111 or 20% completed the InnerSight Assessment Experience while 446 or 80% in the control group did not. Of the out-of-school youth participants for this measure, 251 or 16% completed the InnerSight Assessment Experience while 1277 or 84% in the control group did not.
Attainment: The attainment outcome measure was deemed appropriate for a total of 1547 youth participants of which 564 were in-school-youth (36%) and 983 were out-of-school youth (64%). A total of 305 participants completed the InnerSight Assessment experience (20%) while 1242 (80%) in the control group did not have the Experience.
Of the in-school youth, 111 or 20% completed the InnerSight Assessment Experience while 453 or 80% in the control group did not. Of the out-of-school youth participants for this measure 194 or 20% completed the InnerSight Assessment Experience while 789 or 80% in the control group did not.
Table 1
Study Participant Demographic Information by InnerSight Assessment Experience and Control Groups
for Program Year 2014-15
| Participant Groups | Literacy Assessmenta | Placement Assessment | Attainment Assessment | |||
| N | Average Age | N | Average Age | N | Average Age | |
| Overall | 1665 | 19.1 | 2085 | 18.6 | 1547 | 18.3 |
| InnerSight | 270 | 19.0 | 362 | 18.3 | 305 | 18.3 |
| Control | 1395 | 19.1 | 1723 | 18.6 | 1242 | 18.3 |
| In-school youth: | ||||||
| InnerSight | NA | 111 | 17.1 | 111 | 17.1 | |
| Control | NA | 446 | 17.3 | 453 | 17.3 | |
| Out-of-school youth: | ||||||
| InnerSight | 270 | 19.0 | 251 | 18.9 | 194 | 18.9 |
| Control | 1395 | 19.1 | 1277 | 19.1 | 789 | 18.9 |
| a -All participants on Literacy Outcome measure are Out-of-School Youth. | ||||||
Information for gender and ethnicity of participants was not available in the data extract provided by the City of Los Angeles from the “Jobs LA” performance tracking system. However, the City of Los Angeles did provide total program gender and ethnicity information for program year 2014-15 reflecting a robust and diverse population of participating youth. For 2014-15 there were 1947 females (54.4%), 1630 males (45.6%). The reported ethnic makeup as expected is very diverse with the largest reporting group being Hispanic or Latino followed by White and African American/Black. The mix of Race or Ethnicity in the population is so large that participants are permitted to select more than one race or ethnicity suggesting that the standard race identification categories are rapidly becoming ineffective demographic descriptors or study variables for this population.
Analysis: As Borden (2009) suggests, a good measure must produce a rate of success and not simply a count of activities. Therefore, the rate of success on each of the WIOA performance measures (literacy, placement and attainment) will be calculated for participants appropriate for assessment on each measure as an indicator of program performance. To assess the impact of the InnerSight Assessment Experience, the percent succeeding on each measure will be compared for those who had the InnerSight Assessment Experience with those who did not have the Experience (control group). Differences in rate of performance will be analyzed using chi-square to determine if they are significant or if they occurred by chance alone.
Similar analysis will be conducted within each measure where appropriate to compare the rate of performance of in-school-youth and out-of-school youth who have had the InnerSight Assessment Experience with those who have not.
Analysis of variance will be used where appropriate to identify any within group or interactive differences that may be associated with age of the participant.
Results
The performance rates of participating youth successfully meeting the performance standard for program year 2014-15 are provided in Table 2 for each of the three outcome measures. The overall rate of successful performance is 70% for Placement, 49% for Attainment and 43% for Literacy. Table 2 reveals considerable variance in performance rates between in-school youth and out-of-school youth as well as between those who have had the InnerSight Assessment Experience and those who have not on the Literacy and Attainment outcomes. Performance rate comparisons and examination of significant differences are provided below by WIOA outcome performance measure.
Table 2
Rate of Successful Performance 2014-15:
Percent of Participating Youth Achieving Outcome Measure
| Literacy Outcome1 | Placement Outcome | Attainment Outcome | |
| Overall | 43% | 70% | 49% |
| InnerSight | 48% | 69% | 58% |
| Control | 42% | 70% | 47% |
| In-school youth: | 73% | 80% | |
| InnerSight | – | 71% | 85% |
| Control | – | 73% | 79% |
| Out-of-School youth: | 43% | 69% | 32% |
| InnerSight | 48% | 69% | 43% |
| Control | 42% | 69% | 29% |
| 1All participants on Literacy Outcome measure are Out-of-School Youth. | |||
Literacy: Only out-of-school youth participate in the literacy outcome measure. For the 2014-15 program year population, 43% met the standard. Those who had The InnerSight Assessment Experience had a 48% success rate while those who did not achieved a 42% success rate. This suggests InnerSight Assessment Experience participants are more likely than other participants to achieve the literacy standard. The 6% difference in performance rate for those completing the InnerSight Assessment Experience is statistically significant yielding a χ2 value of 3.99 with 1df, N of 1665 and a probability of .046.
Table 3 contains the distribution of participants and their literacy outcomes by age. While participants range in age from 15 to 21, over 99% fall between the age of 17 and 21. Table 3 contains performance success rate by study group and age. Figure 1 provides this information graphically across age for both study groups (InnerSight and control).
Table 3
Percent of Participants Achieving Literacy Standard
by Study Group and Age
| Age | Control | InnerSight | ||
| N | Percent Achieving Standard | N | Percent Achieving Standard | |
| Under 18 | 111 | 34% | 26 | 38% |
| 18 | 355 | 29% | 75 | 41% |
| 19 | 428 | 48% | 78 | 51% |
| 20 | 284 | 45% | 58 | 53% |
| 21 | 217 | 48% | 33 | 55% |
| All | 1395 | 42% | 270 | 48% |
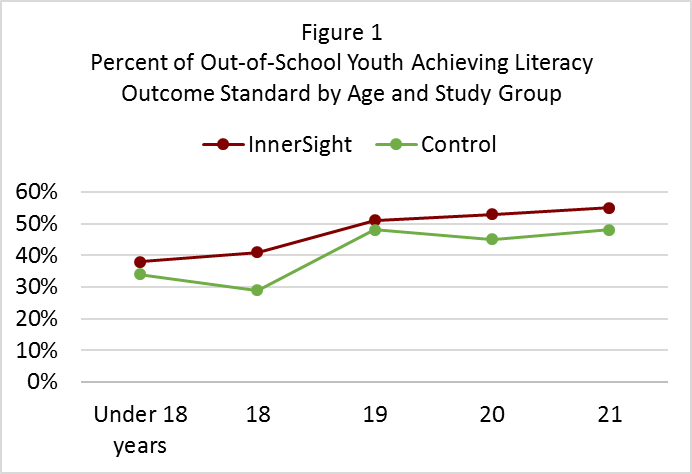
InnerSight Assessment Experience participants have a higher rate of success than the control group across all age groups as can be noted in Table 3 and the graph in Figure 1. It also appears that older participants achieve a higher success rate than younger participants. An analysis of variance of the performance on the literacy standard examined the impact of age and the InnerSight Assessment Experience. Both the InnerSight Assessment Experience and Age have statistically significant impacts on the rate of Performance on the Literacy Outcome, producing values of F=9.719, p<.010, and F=17.001, p<.009 respectively. This suggests the InnerSight Assessment Experience and age have a positive effect on the outcome.
There was no interaction effect between the InnerSight Assessment Experience and age on the Literacy performance outcome. The statistical analysis of this effect yielded a value of F=.266, p<.900. Thus the positive increase in Literacy performance rate attributable to the InnerSight Assessment Experience is not affected by participant age. (See note 1 for complete ANOVA results.)
Placement: For the 2014–15 program year, 70% met the placement outcome standard. Table 1 shows that the rate of achievement on the Placement standard does not differ between in-school and out-of-school youth or between InnerSight Assessment Experience participants and the control group. Table 4 contains the number of participants and associated success rates by age, study group (InnerSight and Control) and school status (in-school and out-of-school). Statistical analysis revealed no significant differences in performance rates associated with participation group, school status, or age. This suggests that neither the InnerSight Assessment Experience, nor youth school status or age impacts the success rate on the placement outcome measure.
Table 4
Distribution of Participants and Rate of Success on Placement Outcome
by Age, School Status and Study Group
| Participant Groups | Under 18 | 18 | 19 | 20 | 21 | All | ||||||
| N | % a | N | % a | N | % a | N | % a | N | % a | N | % a | |
| Overall | 553 | 72% | 510 | 62% | 499 | 75% | 307 | 74% | 216 | 64% | 2085 | 70% |
| InnerSight | 116 | 70% | 89 | 65% | 86 | 74% | 47 | 72% | 24 | 58% | 362 | 69% |
| Control | 437 | 73% | 421 | 61% | 413 | 76% | 260 | 75% | 192 | 65% | 1723 | 70% |
| In-school youth: | 412 | 75% | 112 | 63% | 25 | 72% | 5 | 60% | 3 | 67% | 557 | 73% |
| InnerSight | 88 | 72% | 16 | 63% | 5 | 100% | 2 | 50% | 0 | ~ | 111 | 71% |
| Control | 324 | 76% | 96 | 64% | 20 | 65% | 3 | 67% | 3 | 67% | 446 | 73% |
| Out-of-School youth: | 141 | 62% | 398 | 61% | 474 | 76% | 302 | 75% | 213 | 64% | 1528 | 69% |
| InnerSight | 28 | 64% | 73 | 66% | 81 | 73% | 45 | 73% | 24 | 58% | 251 | 69% |
| Control | 113 | 62% | 325 | 60% | 393 | 76% | 257 | 75% | 189 | 65% | 1277 | 69% |
| a % is the rate of performance on the outcome. | ||||||||||||
Attainment: For the 2014-15 program year, 49% successfully met the attainment outcome measure standard as can be seen in Table 5. The performance measure success rate for those who had the InnerSight Assessment Experience was 58% while the success rate for those who did not have the Experience was 47%. This suggests that those who have the InnerSight Assessment Experience are more likely to achieve success on the attainment outcome performance measure than those who do not. The 11% difference in performance rate for InnerSight Assessment Experience participants was statistically significant, yielding a χ2 value of 11.36, with 1df, N=1547 and a probability of p = .001.
Table 5
Distribution of Attainment Participants and Percent Achieving Attainment by Age,
Study Group and School Status
| Participant Group | Under 18 | 18 | 19 | 20 | 21 | All | ||||||
| N | % a | N | % a | N | % a | N | % a | N | % a | N | % a | |
| Overall | 516 | 78% | 427 | 39% | 285 | 34% | 195 | 29% | 124 | 33% | 1547 | 49% |
| InnerSight | 110 | 84% | 75 | 44% | 59 | 42% | 39 | 41% | 22 | 50% | 305 | 58% |
| Control | 406 | 76% | 352 | 38% | 226 | 32% | 156 | 26% | 102 | 29% | 1242 | 47% |
| In-school-youth: | 413 | 90% | 115 | 62% | 28 | 43% | 5 | 20% | 3 | 0% | 564 | 80% |
| InnerSight | 88 | 92% | 16 | 50% | 5 | 80% | 2 | 50% | 0 | ~ | 111 | 85% |
| Control | 325 | 89% | 99 | 64% | 23 | 35% | 3 | 0% | 3 | 0% | 453 | 79% |
| Out-of-School youth: | 103 | 31% | 312 | 31% | 257 | 33% | 190 | 29% | 121 | 34% | 983 | 32% |
| InnerSight | 22 | 50% | 59 | 42% | 54 | 39% | 37 | 41% | 22 | 50% | 194 | 43% |
| Control | 81 | 26% | 253 | 28% | 203 | 32% | 153 | 26% | 99 | 30% | 789 | 29% |
| a % is the rate of performance on the outcome. | ||||||||||||
The impact of the InnerSight Assessment Experience on the Attainment outcome differs dramatically for in-school and out-of-school youth. The success rate of 85% for in-school youth on the attainment measure who had the InnerSight Assessment Experience was not significantly greater than the 79% success rate for in-school youth who did not have the Experience. The statistical analysis yielded a χ2 value of 1.544 with 1df and an N=564 with a probability of p = .214.
Further review of Table 5 for in-school- youth reveals a substantial change in performance rate for youth under 18 and those 18 and older. When examined by these age groupings a performance rate of 90% is observed for the 413 in-school youth under 18 compared to a performance rate of 57% for the 151 in- school youth who are 18 and older. The 33% difference in performance is statistically significant yielding a χ2 value of 81.222 with 1df and an N=564 with a probability of p = .000. When analyzed separately by InnerSight and control group the results are similar. This seems to suggest a powerful effect for age or life events associated with age.
Examination of the success rates for the WIOA critical population of out-of-school youth shows that those who complete the InnerSight Assessment Experience are significantly more likely than their peers to achieve success on the Attainment performance measure. The success rate on the Attainment outcome measure for those having the InnerSight Assessment Experience is 43% versus 29% for those who do not. This 14% difference in the performance rate is statistically significant yielding a χ2 value of 14.6 with 1df, an N of 983 and a probability of p = .00.
For out-of-school youth, a univariate Analysis of Variance of the InnerSight Assessment Experience and age shows that there is a statistically significant difference (F=26.210, p<.002) between the InnerSight group and the Control group, but age has no impact. Furthermore, there was no interaction effect of age with the InnerSight Assessment Experience (F=.527, p<.716). Thus the InnerSight Assessment Experience makes a significant difference and is not impacted by participant age. Figure 2 shows that the InnerSight Assessment Experience impact on Attainment is not isolated to only the youngest or the oldest participants. (See Statistical Analysis note 2 for complete ANOVA results.)
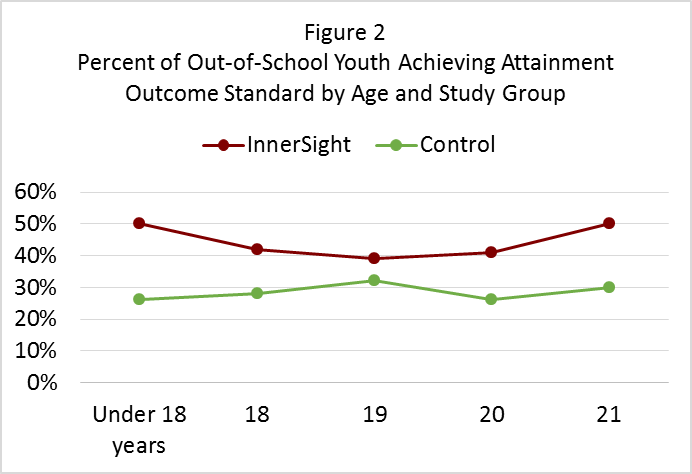
Examining research question one, the results show that youth who have the InnerSight Assessment Experience achieve successful performance on the attainment and literacy performance measures at a significantly greater rate than those who do not have the Experience. With regard to the placement outcome measure, rate of performance is not impacted by the InnerSight Assessment Experience for any group.
On research question two, the results show a significant difference between the successful performance rate of out-of-school youth (WIOA’s primary target group) who have the InnerSight Assessment Experience and those who do not on the attainment and literacy outcome measures. Out-of-school youth who had the InnerSight Assessment Experience performed significantly better on the attainment outcome measure (+14%) and on the literacy outcome measure (+6%) than those who did not have the Experience.
Discussion
The literature offers virtually no research on program elements that impact youth success on WIOA performance outcomes. Existing research (Moore and Gorman, 2009) focused only on the impact of participant demographic characteristics on outcome measures. Borden (2009) noted that performance management systems do not specify how services are delivered and that measures of program performance must produce a rate of success and not simply a count of activities. This study responds to both of these concerns with a focus on the InnerSight Assessment Experience as a program element in service delivery and its impact on participant rate of performance on WIOA outcome measures.
The finding that out-of-school youth meet the attainment performance standard at a 14% greater rate if they have the InnerSight Assessment Experience (49%) than those who do not (29%) is not only statistically significant but makes it clear that program elements influence participant performance on WIOA outcome measures. Results were similar on the literacy outcome measure with a 6% significantly greater rate of performance for out-of-school youth who had the InnerSight Assessment Experience (48%) than those who did not (42%).
The target population for this study was young people who are the most persistently disconnected. The findings provide evidence that the InnerSight Assessment Experience is an intensive interpretive program element that works in engaging them. When connected with case manager follow-up using the InnerSight ExperienceTM results to chart next steps related to educational and occupational goals, the results are personally engaging, developmental, and productive. This is one of those new strategies Hossain (2015) says is needed and should be a priority in reaching and engaging alienated and disaffected young people.
Hossain recommends “asking young people for their input in designing program activities and allowing them to have a voice in program governance.” (p.4) The InnerSight Assessment Experience capitalizes on this by increasing the youth’s voice in the use of their personal assessment results in designing a personal pathway to success. This is particularly productive in establishing individualized short-term and long-term goals as required by WIOA in each youth’s Individual Service Plan.
Kazis (2016) suggests there is a paucity of research on how to positively engage the participant in his/her personal development of a successful career pathway. The findings of this study respond to this concern and suggests a useful building block is the effective use of personal assessment results. Far too many times, assessment is viewed as something we do to people, or for them, rather than with them. Thus we lose the opportunity for meaningful engagement, personal exploration and the power of personal validation is lost. Such engagement takes time and some professional expertise with the assessment tool which often is not available in many WIOA programs but in this study was provided through the InnerSight Assessment Experience. Case managers are easily trained to work with youth participants and the results in their InSight Guide results booklets to discuss and plan together important educational and career next steps. Such collaborative work leads to the program impact on performance outcomes found in this study.
The placement outcome measure performance rate was not influenced by the InnerSight Assessment Experience and is most likely a result of individual provider agency contacts and networking skills rather than the personal development of the youth participant. This would be an interesting area for further analysis and study.
The results for in-school youth revealed a significant effect for age on the attainment success rate. There was a substantial change in performance rate for youth under 18 when compared with those 18 and older. A performance rate of 90% was observed for the 413 in-school youth under 18 compared to a performance rate of 57% for the 151 in-school youth who are 18 and older. Moore and Gorman (2009) in their study of the impact of demographics on WIA program performance of adults and dislocated workers also found an effect for age of participant. These finding suggests a strong need for further research to better understand the effect of age or life events associated with age on WIOA outcome performance measures.
Service program elements clearly have a profound impact on WIOA performance outcomes as found in this study. However, there continues to be a paucity of research at the service delivery level identifying what service efforts have the most impact. This impact study was designed to take a first step with the expectation that others would follow to help define a universe of practices that make a significant difference in performance as found in this initial effort.
The statistical findings regarding the InnerSight Assessment Experience provides evidence of a positive difference but does not shed light on how the Experience is perceived by youth. Participants’ feelings and descriptions of the Experience were collected in 1539 written statements shared on the youth evaluations of the sixty-eight Experience sessions. These statements offer insight into their perceptions.
When asked what they liked most about the Experience youth said, “Keep up the work. There are many people out there like me who are lost and not sure what to do. But with this book and your help, there are paths that seem to open & lighten up.” Another youth said, “This experience helped me get a clearer understanding of what I would like in my future career and I learned a lot about myself.”
Participants like that it is all about “me”. Many of the statements refer to “myself” such as, “Learning things about myself that I can describe in an interview.” One youth said, “I enjoyed the clear and concise approach of the InnerSight Experience, to be able to decipher myself.” Another shared, “I liked how it gave very good info about myself that I know subconsciously, but this put it into words that I couldn’t do myself”. A third wrote, “That I discovered my passion (nursing).” This is perhaps the first time they have been in a class that literally maintains a focus on them.
They like that it opens their eyes to career opportunities. “Career” is specifically mentioned in 175 written statements. A youth said, “InnerSight was an amazing experience for me. It helped me figure out what career path to take and reassured me on what I like to do.” Two others shared, “It opened my eyes to all of my available job opportunities. I loved this.” and “I was able to look outside the box of just one career.” They mention they learned about careers they might never have considered with statements such as, “I like how much it opened my eyes as well as my mind to new opportunities. I have a stronger direction in life.” and “I learned about career choices that I really did not take into consideration during my process in applying to college.”
It is interesting to note that some 80 statements refer to the certified InnerSight Guides who facilitate the Experience. Youth shared the following: “I loved the communication and even though it was a large group, the topics and session as a whole was very personalized. The presenters were very helpful, friendly and genuine.”; “I liked how the instructor was clear and had a happy personality. It made the environment and the entire presentation much more enjoyable.” and “I liked that it was a very friendly environment. The speaker was enthusiastic and willing to help and explain.” These observations emphasize the importance of the facilitators’ and subsequent case managers’ effective personal interaction with the youth.
Many statements referenced the materials themselves including the InSight Guide booklet that is personalized for each participant. Some of these statements include, “I liked the booklet, it contains really useful information that can be used along our educational paths, job hunting, and to see our preferences and interests.” They shared their views on the accuracy of the results, “The inventory results were very accurate, helped me learn more about my career and I’m 100% sure that physical therapy is what I want to do.” Some identified new skills they acquired, “Learning more about the qualities that make (me) who I am and getting an insight on what other possibilities I can attain.” and “I think I’m more prepared to talk to employers.” Observations such as the above reinforce the engaging and personal aspects of the materials. They actually put participants in the process and bring the Experience alive.
The personal statements suggest participants appreciate the focus on them, the new information they gain about careers, personal career fit, as well as the personal attention and responsiveness of the InnerSight Assessment Experience. Participants embraced the new information saying, “Thank you for a wonderful Saturday morning it was worth it.” and “I’d like to thank this workshop for being here because without it I’d be lost.” Many learned about occupations they may never have considered while others gained confirmation of their current pathways. Most importantly they liked that it is “All About Me.”
Implications and Considerations
- There is a need for additional research to identify those service delivery program elements that contribute to a participant’s success.
- Policy makers, and especially workforce investment boards, need to assure that data elements are created in their performance systems to facilitate the study of service level program impact on outcome performance.
- There is a need to move beyond WIOA performance measures to examine if what is done to, for, and with the participant increases the rate of performance.
- Age of participant has been found to produce an effect in studies of both youth and adult performance on WIA and WIOA program outcome measures. This suggests a need for policy makers and program leaders to consider this in the development of service strategies as well as individual service plans.
- Effective use of assessment results is a powerful building block for establishing rapport, engaging the youth and creating personal pathway to success.
- When participants engage and validate assessment results it places them in a position to make better choices regarding education, training and career options. It builds a sense of personal ownership in the Individual Service Plan and most importantly—they feel it wasn’t done to them. WIOA policy makers will want to understand how this is accomplished by their service providers.
- Professional interpretation of Assessment results, when integrated with case manager’s continuing work with youth on Individual Service Plans, creates a personal bond magnifying the personal connection making the service experience all about them and likely contributes to persistence.
- Policy makers need to be aware that Assessment has often been used ineffectively. When professionally guided on how to use and apply their own assessment results, participants engage and become developmentally productive.
- Statistical evidence while standing alone does not tell the whole story. Participants in their evaluative statements emphasize their appreciation for what they learn and that they are invited to fully engage in the process. This suggests that programs need to move beyond transactional processes when working with youth.
References
Barnow, G., and Smith, Jeffrey. “Performance Management of U.S. Job Training Programs: Lessons from the Job Training Partnership Act.” Public Finance and Management, vol. 4, no. 3, 2004, pp. 247-287.
Borden, William S., Nov. 2009 Mathematica Policy Research, The Challenges of Measuring Employment Program Performance, in a paper delivered at the 2009 conference What the European Social Fund Can Learn from the WIA Experience. Retrieved from
http://www.umdcipe.org/conferences/WIAWashington/Papers/Borden-Challenges-of-Measuring_Employment_Program_Performance.pdf
Dunham, K., Mack, M., Salzman, J., Wiegand, A., May 2006, Evaluation of the WIA Performance Measurement System – Final Report. Retrieved from
https://wdr.doleta.gov/research/FullText_Documents/Evaluation%20of%20the%20WIA%20Performance%20Measurement%20System%20-%20Final%20Report.pdf
Hossain, Farhana (2015). Serving Out-of-School Youth Under the Workforce Innovation and Opportunity Act (2014). Retrieved from
http://www.mdrc.org/publication/serving-out-school-youth-under-workforce-innovation-and-opportunity-act-2014
Kazis, Richard (2016). MDRC Research on Career Pathways. Retrieved from
http://www.mdrc.org/publication/mdrc-research-career-pathways
King, C. T. (2004). The effectiveness of publicly financed training services: Implications for WIA and related programs. In C. J. O’Leary, R. A. Straits, & S. A. Wandner (Eds.), Job training policy in the United States. Kalamazoo, MI: W. E. Upjohn Institute for Employment Research.
Moore, R. W., Gorman, P. C., Blake, D. R., Phillips, G. M., Rossy, G., Cohen, E., Grimes, T., & Abad, M. (2004). Lessons from the past and new priorities: A multi-method evaluation of ETP. Sacramento, CA: California Employment Training Panel.
Social Policy Research Associates. (2004). The Workforce Investment Act after Five Years: Results from the National Evaluation of the Implementation of WIA. Retrieved from
https://www.doleta.gov/reports/searcheta/occ/papers/spr-wia_final_report.pdf
U.S. Departments of Education, Health and Human Services, and Labor, “Joint Career Pathways Letter,” April 4, 2012. Retrieved from
http://www2.ed.gov/news/newsletters/ovaeconnection/2012/04122012.html.
United States Department of Labor, Employment and Training Administration (2015). Retrieved from
https://www.doleta.gov/performance/guidance/laws_regs.cfm
United States Departments of Education, Health and Human Services, and Labor, “Joint Career Pathways Letter,” April 4, 2012. Retrieved from
http://www2.ed.gov/news/newsletters/ovaeconnection/2012/04122012.html.
Statistical Analysis Notes
Note 1. Univariate Analysis of Variance of Literacy by InnerSight and Age, Out-of-School Youth, 2014-15
| Between-Subjects Factors | |||
| Value Label | N | ||
| Study Group | 0 | Control | 1395 |
| 1 | InnerSight | 270 | |
| Age | <18 | Under 18 | 137 |
| 18.00 | 18 | 430 | |
| 19.00 | 19 | 506 | |
| 20.00 | 20 | 342 | |
| 21.00 | 21 | 250 | |
| Tests of Between-Subjects Effects | ||||||
| Dependent Variable: Literacy Outcome | ||||||
| Source |
Type III Sum of Squares |
df | Mean Square | F | Sig. | |
| Intercept | Hypothesis | 146.671 | 1 | 146.671 | 152.631 | .000 |
| Error | 4.134 | 4.302 | .961a | |||
| Study Group | Hypothesis | .863 | 1 | .863 | 9.719 | .010 |
| Error | .943 | 10.611 | .089b | |||
| Age | Hypothesis | 4.326 | 4 | 1.082 | 17.001 | .009 |
| Error | .254 | 4 | .064c | |||
| Study Group * Age | Hypothesis | .254 | 4 | .064 | .266 | .900 |
| Error | 396.329 | 1655 | .239d | |||
| a. .857 MS(Age) + .143 MS(Error) | ||||||
| b. .857 MS(StudyGroup * Age) + .143 MS(Error) | ||||||
| c. MS(StudyGroup * Age) | ||||||
| d. MS(Error) | ||||||
Note 2. Univariate Analysis of Variance of Attainment by InnerSight and Age, Out-of-School Youth, 2014-15
| Between-Subjects Factors | |||
| Value Label | N | ||
| Study Group | 0 | Control | 789 |
| 1 | InnerSight | 194 | |
| Age | <18 | Under 18 | 103 |
| 18.00 | 18 | 312 | |
| 19.00 | 19 | 257 | |
| 20.00 | 20 | 190 | |
| 21.00 | 21 | 121 | |
| Tests of Between-Subjects Effects | ||||||
| Dependent Variable: Attainment Outcome | ||||||
| Source |
Type III Sum of Squares |
df | Mean Square | F | Sig. | |
| Intercept | Hypothesis | 69.372 | 1 | 69.372 | 853.662 | .000 |
| Error | .721 | 8.874 | .081a | |||
| Study Group | Hypothesis | 3.292 | 1 | 3.292 | 26.210 | .002 |
| Error | .811 | 6.454 | .126b | |||
| Age | Hypothesis | .249 | 4 | .062 | .552 | .711 |
| Error | .452 | 4 | .113c | |||
| Study Group * Age | Hypothesis | .452 | 4 | .113 | .527 | .716 |
| Error | 208.428 | 973 | .214d | |||
| a. .875 MS(Age) + .125 MS(Error) | ||||||
| b. .875 MS(StudyGroup * Age) + .125 MS(Error) | ||||||
| c. MS(StudyGroup * Age) | ||||||
| d. MS(Error) | ||||||
Do City of Los Angeles Youth who have InnerSight Perform Better on WIOA Outcomes?
Overview
Connecting Out of School Youth Preferences to Career Plans Impacts
YouthSource Program Performance
The City of Los Angeles Economic and Workforce Development Department’s YouthSource program is a premier provider of service for in and out-of-school youth. The city serves some 17,000 youth in its annual and summer programs. The Los Angeles YouthSource program has been nationally acclaimed by the Department of Labor for its progressive commitment to serving out-of-school youth. In 2012 before the new WIOA requirements, the City made a substantial commitment to serving this population requiring 70% of the youth served at its 13 YouthSource sites be out-of-school youth. As a result, they have become the nation’s most successful program in addressing the needs of this underserved population.
In 2012 the YouthSource program implemented the InnerSight Assessment Experience to:
- Actively engage participants in the development of their individual plan.
- Provide caseworkers with a foundation for development of individual plans grounded in participant’s assessment results.
- Connect individual plans and strategies to specific educational, training and occupational goals.
- Help caseworkers and clients see those skills needed to achieve occupational fit.
- Provide documentation of participant and case manager mutual engagement and results oriented planning.
A recently released study “Assessment Program Impact on Successful WIOA Program Performance in the City of Los Angeles YouthSource Program” shows that out-of-school youth participating in the City’s InnerSight Assessment Experience achieve the educational attainment outcome measure at a significantly greater rate. Forty-three percent (43%) of the out-of-school youth who have the assessment experience achieve the attainment goal for a statistically significant 14% improvement over the 29% attainment rate of those without the experience.
The study also revealed a 48% success rate in achieving the literacy standard for youth participating in the InnerSight Assessment Experience versus a 42% success rate for nonparticipants. Findings indicate success rates for the WIOA critical population of out-of-school youth who complete the InnerSight Assessment Experience are significantly higher than their peers on the Attainment and Literacy performance measures.
The City selected this assessment program to help WIOA staff align youth and adults with education, training programs, internships, and actual job openings that are a best fit for them. The findings affirm that when interests and preferences are aligned and self-validated by the individual, their success rate increases.
Through the InnerSight Assessment Experience, youth come to see they are the “Key” to their personal, educational, and career training choices and gain important information about themselves to reflect upon when making those choices. After self-validating their personal interests and preferences for working, learning, leading, risk taking, and team orientation, participants are equipped to explore occupations of people who are satisfied in various occupations and share the participants’ interests.
When asked what they liked most about the Experience youth say, “Keep up the work. There are many people out there like me who are lost and not sure what to do. But with this book and your help, there are paths that seem to open & lighten up.” and “This experience helped me get a clearer understanding of what I would like in my future career and I learned a lot about myself.”
Knowing Who You Are… Is the First Step …In Knowing Where You Are Going!
Full Study
Assessment Program Impact on Successful WIOA Program Performance in the City of Los Angeles YouthSource Program
Mark L. Perkins, John E. Reeves, Lolita Mancheno-Smoak, Debora K. Furlong
Abstract
The Workforce Innovation and Opportunity Act (WIOA) measures labor market outcomes as indicators of program performance. This article uses statistical analysis to examine the impact of the InnerSight Assessment Experience on the rate of performance on key outcome measures in the City of Los Angeles YouthSource Program. The findings suggest that the InnerSight Assessment Experience has a positive impact on youth performance on the WIOA performance measures of Attainment and Literacy. The impact is most profound for out-of-school youth, the target service population under WIOA. Implications and considerations for policy makers and future research are provided.
Purpose
The City of Los Angeles Economic Workforce Development Department (EWDD) offers the InnerSight Experience as a consistent program element across its 13 YouthSource service sites. This study examines the impact of this common program element on youth development as indicated by performance on Workforce Innovation and Opportunity Act (WIOA) performance measures of placement, literacy and attainment.
Introduction
The city of Los Angeles YouthSource program is a premier provider of service for in and out-of-school youth. The city serves some 17,000 youth in its annual and summer programs. The Los Angeles YouthSource program has been nationally acclaimed by the Department of Labor for its progressive commitment to serving out-of-school youth. In 2012 before the new WIOA service requirements, the City made a substantial commitment to serving this population when it required that 70% of the youth served at its 13 YouthSource sites be out-of-school youth. As a result, they have become the nation’s most successful program in addressing the needs of this underserved population.
YouthSource program leadership desired to offer a consistent program element to serve youth across its 13 sites. Most importantly they wanted a program element that is developmental for each participant while meeting WIOA expectations and requirements. Specifically, they were seeking a program that would accomplish the following:
- Actively engage participants in the development of their individual plan.
- Provide caseworkers with a foundation for development of individual plans grounded in participant’s assessment results.
- Connect individual plans and strategies to specific educational, training and occupational goals.
- Help caseworkers and clients see those skills needed to achieve occupational fit.
- Provide documentation of participant and case manager mutual engagement and results oriented planning.
They believe a program grounded in participant personal development that connects youth with high demand occupations using their preferences and interests will facilitate persistence in the attainment of educational, training and career goals. To accomplish this, the city issued an RFP and selected the InnerSight Assessment Experience to meet this unique program and developmental objective.
The InnerSight ExperienceTM
The InnerSight Assessment Experience consists of three important steps. First, participants take an online inventory to provide information to clarify their interests and preferences. Second, they participate in a self-validating group interpretation of the inventory known as the InnerSight Experience™. Third, participants share their results with their case managers and lay out the steps in their individual service plan.
The InnerSight Experience gives participants a vocabulary, context, and framework for bringing their personal interests and preferences to bear on life’s choices. This experience puts the “Power of the Person” in the decision-making processes of life. Through the Experience, participants come to see they are the “Key” to their personal, educational, and career training choices and gain important information about themselves upon which to reflect when making those choices.
The InnerSight Experience is collaborative and delivered in a group setting. This interactive experience engages participants in both individual and group exercises that emphasize and highlight the distinctiveness of their personal results.
The InnerSight Assessment Experience consists of an online interest and preference inventory resulting in a personalized InSight Guide® booklet which is the foundation for a 3-hour in person group interpretative experience. By self-validating their personal interests and preferences for working, learning, leading, risk taking, and team orientation, participants are equipped to explore occupations of people who are satisfied in various occupations and share the participants’ interests.
Participants learn that individuals are typically employed for what they know and terminated for what they do or fail to do. When interests and preferences are aligned with an occupation (work tasks), satisfaction, happiness, and superior performance occur. Youth with cultural, familial, and economic barriers are no exception. When engaged in subjects of interest (music, dance, skateboarding, etc.), individuals succeed.
The InnerSight Experience™ is grounded in the prolific research and universally acclaimed Work Types Model of the eminent vocational psychologist Dr. John Holland. The Holland Model was adopted by the Department of Labor as the foundation for their online career exploration system O*NET. This system can be directly accessed from the electronic Insight Guide booklet participants receive after completing the InnerSight Experience by simply clicking on a preferred occupation.
For over 75 years, interests and preferences have been known as key factors in motivation for continued effort. First used in World War I to determine which men might prefer to be cooks or which might prefer to be in the cavalry, interests have proven to be an effective method of determining continued effort/success in education, career, and personal life. Using interests and preferences to help individuals make better life choices is a time-tested and valid approach.
InnerSight uses this approach, but has changed the traditional career assessment/exploration model. Youth are accustomed to being processed, asked what they know (education), or told what they need to know and do next. InnerSight begins the journey by first exploring and having participants validate what they may like or enjoy doing. Additional exercises guide the participants to discover the connection between what they enjoy doing and potential occupations in which people who share their interests are satisfied.
The InnerSight Assessment Experience is designed to help WIOA staff align youth and adults with education, training programs, internships, and actual job openings that are a best fit for them. This study now examines the impact of the InnerSight Experience on WIOA performance measures.
Literature
The literature is replete with studies and meta-analyses of workforce investment program performance. It has long been the interest of policymakers for job-training programs to be evaluated using tangible labor market results for participants. King (2004) notes the Department of Labor has funded a host of studies in recent decades to assess the impact of training programs using such measures.
Moore and Gorman (2009) observed; “Policymakers brought this focus on performance to the creation of the Workforce Investment Act (WIA) in 1998. WIA, which replaced the job training partnership act (JT PA), established 17 performance measures to drive program performance.” They go on to observe that most of the 17 metrics were for labor market outcome indicators, such as changes in participant earnings, rate at which participants are placed in jobs, etc.
Social Policy Research Associates (2004) in an early assessment of WIA implementation noted that the 17 measures made sense to program operators but concluded that some operators felt definitions were vague and perhaps there were too many. As WIA evolved, the Federal Department of Labor elected to move to a new measurement system consisting of fewer labor market outcomes known as “common measures”. Dunham, Mack, Salzman and Wiegand (2006) note that these “common measures were to be implemented for adults beginning in Program Year (PY) 2005, which began July 1, 2005, and for youth in PY 2006 (beginning July 1, 2006)”. (pg.22)
While there is a plethora of publicly available performance data, Moore and Gorman (2009) observe “there is little in depth analysis of the performance of the WIA system or of the likely drivers of the new common measures. Specifically, there has been little published on the relationship between individual participant characteristics and the program performance measures.” In fact, the Moore and Gorman, 2009 study on the impact of training and demographics in WIA program performance is the first we could find examining how the characteristics of participants may or may not influence the outcomes measured.
As might be expected they found demographic characteristics such as age, ethnicity, education etc. account for considerable variance in performance outcomes. These findings led Moore and Gorman to the following policy and program conclusions:
“A system of adjusting performance standards for states, local areas, and agencies that serve more disadvantaged populations is rational and would make good public policy” (p. 393).
“Policymakers should track whether or not the demographics of participants shift away from the most disadvantaged as the WIA-mandated outcome measures change to the new universal performance measures……. One-Stop operators and local area WIBs both have incentive to perform well on the outcome measures, and when outcome measures can be affected simply by adjusting the demographic profile of those served, it would not be surprising if One-Stops and local area WIBs were to shift their resources toward serving those more likely to help improve their outcome measures, rather than those most in need.” (p. 393).
“Data suggest relatively long-term and more expensive training services are not uniformly superior to shorter-term, less costly interventions such as job search assistance and one on one coaching and counseling.” (p. 393)
“No positive impact was found for any form of training on adult WIA participants… This does not mean that participants never benefit from training, but rather that the training intervention needs to be carefully targeted both toward individuals who can benefit from training and toward skills that are demanded by the local labor market. Simply loading WIA participants into available skill training without an individual strategy for each participant is not likely to yield positive outcomes. For dislocated workers, occupational skills training appeared to have a strong positive effect on earnings, and other forms of training were associated with lower earnings. These findings need to be considered by practitioners as they design interventions for individual participants.” (p. 394)
Moore and Gorman identify the profound impact of demographics on WIA performance measures. They go further suggesting “there is a need for researchers to undertake more nuanced studies of the connections between training and labor market outcomes in WIA, with carefully controlled studies to identify the types of participants and types of training most likely to lead to successful outcomes (p. 394) This suggests a need for providers to understand what program elements, assessments, or experiences have a positive impact on participant’s performance on the common WIA metrics.
Borden (2009), in a comprehensive article on the challenges of measuring employment program performance, says “research on employment and training programs focuses primarily on evaluations of the impact of public investment in job-training services”. (p. 2) He goes on to suggest that there is indeed a dichotomy between the program management objectives of performance management and its evaluative objectives. Moore and Gorman focused on the impact of demographic characteristics and their relationship to the achievement of performance measures. This study goes a step further by analyzing the impact of program on the successful achievement of desired performance outcomes and to identify those elements that drive desired job training performance.
Barrow and Smith (2004) clearly suggest that program evaluation and performance management derive from different sources and motives and have deeply committed adherents. The question is not whether we should track or measure program performance but rather how do program elements contribute to the achievement of job-training and employment program objectives. As suggested by Borden (2009), “there is an increasing tendency to leverage the efficiency of analyzing administrative data versus more expensive experimental designs”. (p. 5) The truth is both are needed, but the experimental designs with appropriate stratified samples of participants for randomization with clean and accurate participant data are not only more expensive, but practically impossible to achieve. Thus, impact studies with limitations may be the most informative indicators of positively contributing program elements for achieving job-training program results. Most importantly, as suggested by Borden, a good measure must produce a rate of success and not simply a count of activities.
Borden properly points out that “we must distinguish clearly between service delivery and program management. Performance management systems track common events such as enrollment date, customer characteristics, limited service dates, exit date, and outcomes. Performance management systems do not specify how services are delivered.” (p. 21) nor do they indicate how services impact performance management outcomes. While it is impossible to design measures that account for all factors bearing on the success with a single customer, focused impact studies can be helpful in determining a program or assessment’s potential accountability for or contribution to program outcomes. With clear program performance measures in place we can begin the analysis of those processes and methods that produce the best results for program participants.
The first major update in almost 15 years to the Workforce Investment Act of 1998 (WIA) was signed into law in 2014. The new federal Workforce Innovation and Opportunity Act (WIOA) places greater emphasis on serving out-of-school youth (75% versus 30% under WIA). WIOA defines out-of-school youth as 16 to 24-year-olds who are not attending any school and who have one or more barriers to employment, such as young people who are homeless, are parenting, have disabilities, or have a juvenile criminal record (United States Department of Labor, Employment and Training Administration (2015)). The new law requires states and localities to develop strategies and programs for recruiting and serving more of these young people than ever before.
This could be a daunting task. Hossain (2015) observes that “while a majority of the out-of-school youth seek out opportunities to connect training and work, youth programs often report difficulties in sustaining participation after the initial connection is made. WIOA-funded service providers will not only have to reach more out-of-school youth, they will also need strategies to stimulate sustained, intense engagement in services.” (p. 1) She goes on to observe that “few programs target the young people who are the most persistently disconnected, and there’s not much evidence on what works in engaging them.” (p. 3) Perhaps most importantly she says that “a significant share of out-of-school youth do not enroll in education and training programs because they have been alienated from mainstream institutions, like schools and social welfare agencies, due to earlier negative experiences. New strategies to reach and engage alienated and disaffected young people should be a priority.” (p. 3)
Hossain (2015) suggests programs “have to find a balance between allowing vulnerable young adults some flexibility in regard to program requirements… while developing processes and practices that allow young people to develop autonomy and leadership” (p. 4). Specifically, she recommends “asking young people for their input in designing program activities and allowing them to have a voice in program governance.” (p. 4)
WIOA encourages implementation of career pathway approaches that will support post-secondary education and training for out-of-school youth that is related to the demand for qualified workers in local labor markets. The individualized pathway is to be grounded in an assessment of skills and interests that can inform the participants’ career decision-making while identifying logical short-term next steps consistent with long-range goals.
The US Departments of Education, Health and Human Services, and Labor issued a joint letter in 2012 that provided a common definition of career pathways that encompasses initiatives that begin with secondary or post-secondary education and credentials. According to the letter a career pathway approach is:
“…… A series of connected education and training strategies and support services that enable individuals to secure industry relevant certification and obtain employment within an occupational area and to advance to higher levels of future education and employment in that area.”
Richard Kazis in a MDRC research brief on Career Pathways (2016) observes “there is little rigorous research that assesses the impact of comprehensive career pathways programs that follows individuals from different starting points through a coherent set of educational experiences and “stackable” credentials to the labor market.” (p. 2) His research brief however, goes on to note that there are components that are being studied that might help policymakers as well as program designers and managers. He provides brief summaries of project models that make a difference in several categories including high schools, out-of-school and disconnected youth, and low income adults. Kazis suggests there is a paucity of research on how to positively engage the participant in his/her personal development of a successful career pathway.
Research has primarily focused on program performance yielding discussions of topics such as the importance of the employer network, career demand, issues of program integration, curriculum and process. All of these focus on what is “done to” the participant and rarely on what is “done with them”. With the exception of Moore and Gorman who examined the impact of demographic characteristics on program performance measures there has been virtually no research examining the impact of program elements offered by providers on WIOA performance indicators. This study presents an analysis of a robust population of WIOA participants from a large diverse city exploring the relationship between the participant’s program assessment experience and subsequent performance on WIOA common measures.
Impact Analysis Approach
As noted by Moore and Gorman (2009) and Borden (2009), the gold standard random-assignment experimental design is extremely difficult and virtually cost prohibitive to use with live WIOA programs. This is perhaps why there is virtually no research on the impact of individual program elements on the common WIOA performance measures. As a result, program providers are left with little or no information regarding program elements that significantly impact participant performance on program performance indicators.
While this study might be referred to as a quasi-experimental design, the authors prefer to call it an impact analysis. This is a first step in identifying the impact of an assessment experience on participant’s achievement on WIOA outcome measures. Essentially, it would be helpful to know if the assessment experience significantly impacts youth performance on program outcome measures.
Method
Research Questions: This study analyzed youth participant performance on WIOA outcome measures for youth participating in the City of Los Angeles YouthSource program in program year 2014 – 2015 (PY-1415) to answer the following questions:
- Do youth participants who have the InnerSight Assessment Experience achieve satisfactory performance on the WIOA outcome measures of attainment, literacy and placement at a significantly greater rate than those who have not had the Experience?
- Do out-of-school youth participants who have the InnerSight Assessment Experience achieve satisfactory performance on the WIOA outcome measures of attainment, literacy and placement at a significantly greater rate than out-of-school youth who do not have the Experience?
Study Population: The study population consists of in-school and out-of-school youth participating in the City of Los Angeles YouthSource program at one of 13 provider sites across the City. Study participants are youth the City of Los Angeles included in the performance analysis for each of three WIOA performance outcome criteria for program year 2014–15. Performance of youth participants who have completed the InnerSight Assessment Experience (Experimental Group) is compared with those who did not complete the Experience (Control Group). The outcome performance measures for this study were drawn from the City of Los Angeles “Jobs LA” performance tracking system. The outcome measures for this study are described below.
Literacy– Literacy & Numeracy Gains
This indicator measures the increase by one or more educational functioning levels from out-of-school youth who are basic skills deficient within a one-year period of participating in program services.
Meeting the Standard: Youth meet the outcome standard for this measure if they:
- Show increase in skills as measured by the Comprehensive Adult Student Assessment System (CASAS) Life & Work (reading) and Life Skills (math) Series at program entry within one year of start of program services.
- Increase one educational function level (EFL) in math, reading or both, during each year of program participation.
Placement -Placement in Employment, Education, or Training
This indicator measures whether a participant is in an education or training program that leads to a recognized post-secondary credential or unsubsidized employment in 1st Quarter after program exit. This measure requires a quarterly follow up for one year after program exit.
Meeting the Standard: Youth meet the outcome standard for this measure if they meet one of the following:
- Employed by an unsubsidized organization.
- Entered military service.
- Enrolled in a post-secondary education program.
- Enrolled in an advanced training or occupational skills training program.
Attainment -Credential Rate
This indicator measures the attainment of a high school diploma, GED, or certificate during program participation or by the end of the 1st Quarter after program exit.
Meeting the Standard: Youth meet the outcome standard for this measure if they meet one of the following:
- Receive a High School diploma certifying completion of a secondary school program of studies.
- Receive satisfactory scores on the General Education Development (GED) test.
- Receive a formal award certifying the satisfactory completion of an organized program of study at a post-secondary education program.
Table 1 provides demographic information for the InnerSight Assessment Experience and Control Groups for Program Year 2014-15. The average age for the three study groups ranges from 18.3 to 19.1 years. Since the cohort deemed appropriate for each individual outcome is different it’s helpful to understand the demographics for each outcome cohort as reflected in Table 1.
Literacy: The literacy outcome measure is appropriate only for out-of-school youth. Out of the total 1665 participants, 270 (16%) completed the InnerSight Assessment Experience while 1395 (84%) did not have the Experience.
Placement: The placement outcome measure was deemed appropriate for a total of 2085 youth participants of which 557 were in-school-youth (27%) and 1528 were out-of-school youth (73%). A total of 362 participants completed the InnerSight Assessment experience (17%) while 1723 in the control group did not have the Experience (83%).
Of the in-school youth, 111 or 20% completed the InnerSight Assessment Experience while 446 or 80% in the control group did not. Of the out-of-school youth participants for this measure, 251 or 16% completed the InnerSight Assessment Experience while 1277 or 84% in the control group did not.
Attainment: The attainment outcome measure was deemed appropriate for a total of 1547 youth participants of which 564 were in-school-youth (36%) and 983 were out-of-school youth (64%). A total of 305 participants completed the InnerSight Assessment experience (20%) while 1242 (80%) in the control group did not have the Experience.
Of the in-school youth, 111 or 20% completed the InnerSight Assessment Experience while 453 or 80% in the control group did not. Of the out-of-school youth participants for this measure 194 or 20% completed the InnerSight Assessment Experience while 789 or 80% in the control group did not.
Study Participant Demographic Information by InnerSight Assessment Experience and Control Groups
for Program Year 2014-15
| Participant Groups | Literacy Assessmenta | Placement Assessment | Attainment Assessment | |||
| N | Average Age |
N | Average Age |
N | Average Age |
|
| Overall | 1665 | 19.1 | 2085 | 18.6 | 1547 | 18.3 |
| InnerSight | 270 | 19.0 | 362 | 18.3 | 305 | 18.3 |
| Control | 1395 | 19.1 | 1723 | 18.6 | 1242 | 18.3 |
| In-school youth: | ||||||
| InnerSight | NA | 111 | 17.1 | 111 | 17.1 | |
| Control | NA | 446 | 17.3 | 453 | 17.3 | |
| Out-of-school youth: | ||||||
| InnerSight | 270 | 19.0 | 251 | 18.9 | 194 | 18.9 |
| Control | 1395 | 19.1 | 1277 | 19.1 | 789 | 18.9 |
| a -All participants on Literacy Outcome measure are Out-of-School Youth. | ||||||
Information for gender and ethnicity of participants was not available in the data extract provided by the City of Los Angeles from the “Jobs LA” performance tracking system. However, the City of Los Angeles did provide total program gender and ethnicity information for program year 2014-15 reflecting a robust and diverse population of participating youth. For 2014-15 there were 1947 females (54.4%), 1630 males (45.6%). The reported ethnic makeup as expected is very diverse with the largest reporting group being Hispanic or Latino followed by White and African American/Black. The mix of Race or Ethnicity in the population is so large that participants are permitted to select more than one race or ethnicity suggesting that the standard race identification categories are rapidly becoming ineffective demographic descriptors or study variables for this population.
Analysis: As Borden (2009) suggests, a good measure must produce a rate of success and not simply a count of activities. Therefore, the rate of success on each of the WIOA performance measures (literacy, placement and attainment) will be calculated for participants appropriate for assessment on each measure as an indicator of program performance. To assess the impact of the InnerSight Assessment Experience, the percent succeeding on each measure will be compared for those who had the InnerSight Assessment Experience with those who did not have the Experience (control group). Differences in rate of performance will be analyzed using chi-square to determine if they are significant or if they occurred by chance alone.
Similar analysis will be conducted within each measure where appropriate to compare the rate of performance of in-school-youth and out-of-school youth who have had the InnerSight Assessment Experience with those who have not.
Analysis of variance will be used where appropriate to identify any within group or interactive differences that may be associated with age of the participant.
The performance rates of participating youth successfully meeting the performance standard for program year 2014-15 are provided in Table 2 for each of the three outcome measures. The overall rate of successful performance is 70% for Placement, 49% for Attainment and 43% for Literacy. Table 2 reveals considerable variance in performance rates between in-school youth and out-of-school youth as well as between those who have had the InnerSight Assessment Experience and those who have not on the Literacy and Attainment outcomes. Performance rate comparisons and examination of significant differences are provided below by WIOA outcome performance measure.
Rate of Successful Performance 2014-15:
Percent of Participating Youth Achieving Outcome Measure
| Literacy Outcome1 |
Placement Outcome |
Attainment Outcome |
|
| Overall | 43% | 70% | 49% |
| InnerSight | 48% | 69% | 58% |
| Control | 42% | 70% | 47% |
| In-school youth: | 73% | 80% | |
| InnerSight | – | 71% | 85% |
| Control | – | 73% | 79% |
| Out-of-School youth: | 43% | 69% | 32% |
| InnerSight | 48% | 69% | 43% |
| Control | 42% | 69% | 29% |
| 1All participants on Literacy Outcome measure are Out-of-School Youth. | |||
Literacy: Only out-of-school youth participate in the literacy outcome measure. For the 2014-15 program year population, 43% met the standard. Those who had The InnerSight Assessment Experience had a 48% success rate while those who did not achieved a 42% success rate. This suggests InnerSight Assessment Experience participants are more likely than other participants to achieve the literacy standard. The 6% difference in performance rate for those completing the InnerSight Assessment Experience is statistically significant yielding a χ2 value of 3.99 with 1df, N of 1665 and a probability of .046.
Table 3 contains the distribution of participants and their literacy outcomes by age. While participants range in age from 15 to 21, over 99% fall between the age of 17 and 21. Table 3 contains performance success rate by study group and age. Figure 1 provides this information graphically across age for both study groups (InnerSight and control).
Percent of Participants Achieving Literacy Standard
by Study Group and Age
| Age | Control | InnerSight | ||
| N | Percent Achieving Standard |
N | Percent Achieving Standard |
|
| Under 18 | 111 | 34% | 26 | 38% |
| 18 | 355 | 29% | 75 | 41% |
| 19 | 428 | 48% | 78 | 51% |
| 20 | 284 | 45% | 58 | 53% |
| 21 | 217 | 48% | 33 | 55% |
| All | 1395 | 42% | 270 | 48% |
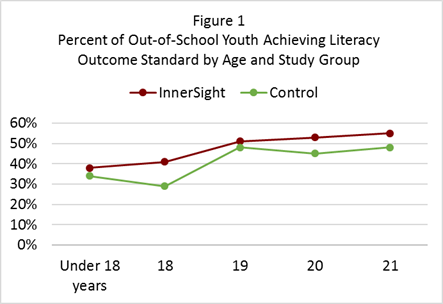
InnerSight Assessment Experience participants have a higher rate of success than the control group across all age groups as can be noted in Table 3 and the graph in Figure 1. It also appears that older participants achieve a higher success rate than younger participants. An analysis of variance of the performance on the literacy standard examined the impact of age and the InnerSight Assessment Experience. Both the InnerSight Assessment Experience and Age have statistically significant impacts on the rate of Performance on the Literacy Outcome, producing values of F=9.719, p<.010, and F=17.001, p<.009 respectively. This suggests the InnerSight Assessment Experience and age have a positive effect on the outcome.
There was no interaction effect between the InnerSight Assessment Experience and age on the Literacy performance outcome. The statistical analysis of this effect yielded a value of F=.266, p<.900. Thus the positive increase in Literacy performance rate attributable to the InnerSight Assessment Experience is not affected by participant age. (See note 1 for complete ANOVA results.)
Placement: For the 2014–15 program year, 70% met the placement outcome standard. Table 1 shows that the rate of achievement on the Placement standard does not differ between in-school and out-of-school youth or between InnerSight Assessment Experience participants and the control group. Table 4 contains the number of participants and associated success rates by age, study group (InnerSight and Control) and school status (in-school and out-of-school). Statistical analysis revealed no significant differences in performance rates associated with participation group, school status, or age. This suggests that neither the InnerSight Assessment Experience, nor youth school status or age impacts the success rate on the placement outcome measure.
Distribution of Participants and Rate of Success on Placement Outcome
by Age, School Status and Study Group
| Participant Groups | Under 18 | 18 | 19 | 20 | 21 | All | ||||||
| N | % a | N | % a | N | % a | N | % a | N | % a | N | % a | |
| Overall | 553 | 72% | 510 | 62% | 499 | 75% | 307 | 74% | 216 | 64% | 2085 | 70% |
| InnerSight | 116 | 70% | 89 | 65% | 86 | 74% | 47 | 72% | 24 | 58% | 362 | 69% |
| Control | 437 | 73% | 421 | 61% | 413 | 76% | 260 | 75% | 192 | 65% | 1723 | 70% |
| In-school youth: | 412 | 75% | 112 | 63% | 25 | 72% | 5 | 60% | 3 | 67% | 557 | 73% |
| InnerSight | 88 | 72% | 16 | 63% | 5 | 100% | 2 | 50% | 0 | ~ | 111 | 71% |
| Control | 324 | 76% | 96 | 64% | 20 | 65% | 3 | 67% | 3 | 67% | 446 | 73% |
| Out-of-School youth: | 141 | 62% | 398 | 61% | 474 | 76% | 302 | 75% | 213 | 64% | 1528 | 69% |
| InnerSight | 28 | 64% | 73 | 66% | 81 | 73% | 45 | 73% | 24 | 58% | 251 | 69% |
| Control | 113 | 62% | 325 | 60% | 393 | 76% | 257 | 75% | 189 | 65% | 1277 | 69% |
| a% is the rate of performance on the outcome. | ||||||||||||
Attainment: For the 2014-15 program year, 49% successfully met the attainment outcome measure standard as can be seen in Table 5. The performance measure success rate for those who had the InnerSight Assessment Experience was 58% while the success rate for those who did not have the Experience was 47%. This suggests that those who have the InnerSight Assessment Experience are more likely to achieve success on the attainment outcome performance measure than those who do not. The 11% difference in performance rate for InnerSight Assessment Experience participants was statistically significant, yielding a χ2 value of 11.36, with 1df, N=1547 and a probability of p = .001.
Distribution of Attainment Participants and Percent Achieving Attainment by Age,
Study Group and School Status
| Participant Group | Under 18 | 18 | 19 | 20 | 21 | All | ||||||
| N | % a | N | % a | N | % a | N | % a | N | % a | N | % a | |
| Overall | 516 | 78% | 427 | 39% | 285 | 34% | 195 | 29% | 124 | 33% | 1547 | 49% |
| InnerSight | 110 | 84% | 75 | 44% | 59 | 42% | 39 | 41% | 22 | 50% | 305 | 58% |
| Control | 406 | 76% | 352 | 38% | 226 | 32% | 156 | 26% | 102 | 29% | 1242 | 47% |
| In-school-youth: | 413 | 90% | 115 | 62% | 28 | 43% | 5 | 20% | 3 | 0% | 564 | 80% |
| InnerSight | 88 | 92% | 16 | 50% | 5 | 80% | 2 | 50% | 0 | ~ | 111 | 85% |
| Control | 325 | 89% | 99 | 64% | 23 | 35% | 3 | 0% | 3 | 0% | 453 | 79% |
| Out-of-School youth: | 103 | 31% | 312 | 31% | 257 | 33% | 190 | 29% | 121 | 34% | 983 | 32% |
| InnerSight | 22 | 50% | 59 | 42% | 54 | 39% | 37 | 41% | 22 | 50% | 194 | 43% |
| Control | 81 | 26% | 253 | 28% | 203 | 32% | 153 | 26% | 99 | 30% | 789 | 29% |
| a% is the rate of performance on the outcome. | ||||||||||||
The impact of the InnerSight Assessment Experience on the Attainment outcome differs dramatically for in-school and out-of-school youth. The success rate of 85% for in-school youth on the attainment measure who had the InnerSight Assessment Experience was not significantly greater than the 79% success rate for in-school youth who did not have the Experience. The statistical analysis yielded a χ2 value of 1.544 with 1df and an N=564 with a probability of p = .214.
Further review of Table 5 for in-school- youth reveals a substantial change in performance rate for youth under 18 and those 18 and older. When examined by these age groupings a performance rate of 90% is observed for the 413 in-school youth under 18 compared to a performance rate of 57% for the 151 in- school youth who are 18 and older. The 33% difference in performance is statistically significant yielding a χ2 value of 81.222 with 1df and an N=564 with a probability of p = .000. When analyzed separately by InnerSight and control group the results are similar. This seems to suggest a powerful effect for age or life events associated with age.
Examination of the success rates for the WIOA critical population of out-of-school youth shows that those who complete the InnerSight Assessment Experience are significantly more likely than their peers to achieve success on the Attainment performance measure. The success rate on the Attainment outcome measure for those having the InnerSight Assessment Experience is 43% versus 29% for those who do not. This 14% difference in the performance rate is statistically significant yielding a χ2 value of 14.6 with 1df, an N of 983 and a probability of p = .00.
For out-of-school youth, a univariate Analysis of Variance of the InnerSight Assessment Experience and age shows that there is a statistically significant difference (F=26.210, p<.002) between the InnerSight group and the Control group, but age has no impact. Furthermore, there was no interaction effect of age with the InnerSight Assessment Experience (F=.527, p<.716). Thus the InnerSight Assessment Experience makes a significant difference and is not impacted by participant age. Figure 2 shows that the InnerSight Assessment Experience impact on Attainment is not isolated to only the youngest or the oldest participants. (See Statistical Analysis note 2 for complete ANOVA results.)
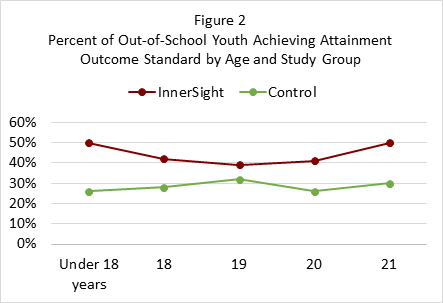
Examining research question one, the results show that youth who have the InnerSight Assessment Experience achieve successful performance on the attainment and literacy performance measures at a significantly greater rate than those who do not have the Experience. With regard to the placement outcome measure, rate of performance is not impacted by the InnerSight Assessment Experience for any group.
On research question two, the results show a significant difference between the successful performance rate of out-of-school youth (WIOA’s primary target group) who have the InnerSight Assessment Experience and those who do not on the attainment and literacy outcome measures. Out-of-school youth who had the InnerSight Assessment Experience performed significantly better on the attainment outcome measure (+14%) and on the literacy outcome measure (+6%) than those who did not have the Experience.
Discussion
The literature offers virtually no research on program elements that impact youth success on WIOA performance outcomes. Existing research (Moore and Gorman, 2009) focused only on the impact of participant demographic characteristics on outcome measures. Borden (2009) noted that performance management systems do not specify how services are delivered and that measures of program performance must produce a rate of success and not simply a count of activities. This study responds to both of these concerns with a focus on the InnerSight Assessment Experience as a program element in service delivery and its impact on participant rate of performance on WIOA outcome measures.
The finding that out-of-school youth meet the attainment performance standard at a 14% greater rate if they have the InnerSight Assessment Experience (49%) than those who do not (29%) is not only statistically significant but makes it clear that program elements influence participant performance on WIOA outcome measures. Results were similar on the literacy outcome measure with a 6% significantly greater rate of performance for out-of-school youth who had the InnerSight Assessment Experience (48%) than those who did not (42%).
The target population for this study was young people who are the most persistently disconnected. The findings provide evidence that the InnerSight Assessment Experience is an intensive interpretive program element that works in engaging them. When connected with case manager follow-up using the InnerSight ExperienceTM results to chart next steps related to educational and occupational goals, the results are personally engaging, developmental, and productive. This is one of those new strategies Hossain (2015) says is needed and should be a priority in reaching and engaging alienated and disaffected young people.
Hossain recommends “asking young people for their input in designing program activities and allowing them to have a voice in program governance.” (p.4) The InnerSight Assessment Experience capitalizes on this by increasing the youth’s voice in the use of their personal assessment results in designing a personal pathway to success. This is particularly productive in establishing individualized short-term and long-term goals as required by WIOA in each youth’s Individual Service Plan.
Kazis (2016) suggests there is a paucity of research on how to positively engage the participant in his/her personal development of a successful career pathway. The findings of this study respond to this concern and suggests a useful building block is the effective use of personal assessment results. Far too many times, assessment is viewed as something we do to people, or for them, rather than with them. Thus we lose the opportunity for meaningful engagement, personal exploration and the power of personal validation is lost. Such engagement takes time and some professional expertise with the assessment tool which often is not available in many WIOA programs but in this study was provided through the InnerSight Assessment Experience. Case managers are easily trained to work with youth participants and the results in their InSight Guide results booklets to discuss and plan together important educational and career next steps. Such collaborative work leads to the program impact on performance outcomes found in this study.
The placement outcome measure performance rate was not influenced by the InnerSight Assessment Experience and is most likely a result of individual provider agency contacts and networking skills rather than the personal development of the youth participant. This would be an interesting area for further analysis and study.
The results for in-school youth revealed a significant effect for age on the attainment success rate. There was a substantial change in performance rate for youth under 18 when compared with those 18 and older. A performance rate of 90% was observed for the 413 in-school youth under 18 compared to a performance rate of 57% for the 151 in-school youth who are 18 and older. Moore and Gorman (2009) in their study of the impact of demographics on WIA program performance of adults and dislocated workers also found an effect for age of participant. These finding suggests a strong need for further research to better understand the effect of age or life events associated with age on WIOA outcome performance measures.
Service program elements clearly have a profound impact on WIOA performance outcomes as found in this study. However, there continues to be a paucity of research at the service delivery level identifying what service efforts have the most impact. This impact study was designed to take a first step with the expectation that others would follow to help define a universe of practices that make a significant difference in performance as found in this initial effort.
Implications and Considerations
- There is a need for additional research to Identify those service delivery program elements that contribute to a participant’s success.
- Policy makers, and especially workforce investment boards, need to assure that data elements are created in their performance systems to facilitate the study of service level program impact on outcome performance. More specifically, there is a need to move beyond a specific WIOA performance measure to examine if what is done to, for, and with the participant increases the rate of performance.
- Age of participant has been found to produce an effect in studies of both youth and adult performance on WIA and WIOA program outcome measures. This suggests a need for further research on age impact and for policy makers and program leaders to consider this in the development of service strategies as well as individual service plans.
- Effective use of assessment results is a powerful building block for establishing rapport, engaging the youth and creating personal pathway to success. Requiring youth participants to engage and validate assessment results places them in a position to make better choices regarding education, training and career options. Their input is vital for program success as it builds a sense of personal ownership in the Individual Service Plan and most importantly– it wasn’t done to them. As a major WIOA expectation policy makers will want to understand how this is accomplished by their service providers.
- Professional interpretation of Assessment results, when integrated with case manager’s continuing work with youth on their Individual Service Plans, creates a personal bond and magnifies the power of the personal connection with the program making the service experience all about them and likely contributes to persistence.
- Policy makers need to be aware that Assessment has often been used ineffectively and has come to have negative connotations associated with it, especially when it is done to a participant. Consider the impact of high stakes assessment in our schools on student and parent attitudes about assessment and they bring those attitudes with them to WIOA programs. However, when individual participants are professionally guided on how to use and apply their own assessment results the experience can be quite different and developmentally productive.
References
Barnow, G., and Smith, Jeffrey. “Performance Management of U.S. Job Training Programs: Lessons from the Job Training Partnership Act.” Public Finance and Management, vol. 4, no. 3, 2004, pp. 247-287.
Borden, William S., Nov. 2009 Mathematica Policy Research, The Challenges of Measuring Employment Program Performance, in a paper delivered at the 2009 conference What the European Social Fund Can Learn from the WIA Experience. Retrieved from http://www.umdcipe.org/conferences/WIAWashington/Papers/Borden-Challenges-of-Measuring_Employment_Program_Performance.pdf
Dunham, K., Mack, M., Salzman, J., Wiegand, A., May 2006, Evaluation of the WIA Performance Measurement System – Final Report. Retrieved from https://wdr.doleta.gov/research/FullText_Documents/Evaluation%20of%20the%20WIA%20Performance%20Measurement%20System%20-%20Final%20Report.pdf
Hossain, Farhana (2015). Serving Out-of-School Youth Under the Workforce Innovation and Opportunity Act (2014). Retrieved from
http://www.mdrc.org/publication/serving-out-school-youth-under-workforce-innovation-and-opportunity-act-2014
Kazis, Richard (2016). MDRC Research on Career Pathways. Retrieved from http://www.mdrc.org/publication/mdrc-research-career-pathways
King, C. T. (2004). The effectiveness of publicly financed training services: Implications for WIA and related programs. In C. J. O’Leary, R. A. Straits, & S. A. Wandner (Eds.), Job training policy in the United States. Kalamazoo, MI: W. E. Upjohn Institute for Employment Research.
Moore, R. W., Gorman, P. C., Blake, D. R., Phillips, G. M., Rossy, G., Cohen, E., Grimes, T., & Abad, M. (2004). Lessons from the past and new priorities: A multi-method evaluation of ETP. Sacramento, CA: California Employment Training Panel.
Social Policy Research Associates. (2004). The Workforce Investment Act after Five Years: Results from the National Evaluation of the Implementation of WIA. Retrieved from https://www.doleta.gov/reports/searcheta/occ/papers/spr-wia_final_report.pdf
U.S. Departments of Education, Health and Human Services, and Labor, “Joint Career Pathways Letter,” April 4, 2012. Retrieved from http://www2.ed.gov/news/newsletters/ovaeconnection/2012/04122012.html.
United States Department of Labor, Employment and Training Administration (2015). Retrieved from https://www.doleta.gov/performance/guidance/laws_regs.cfm
United States Departments of Education, Health and Human Services, and Labor, “Joint Career Pathways Letter,” April 4, 2012. Retrieved from http://www2.ed.gov/news/newsletters/ovaeconnection/2012/04122012.html.
Note 1. Univariate Analysis of Variance of Literacy by InnerSight and Age, Out-of-School Youth, 2014-15
| Value Label | N | ||
| Study Group | 0 | Control | 1395 |
| 1 | InnerSight | 270 | |
| Age | <18 | Under 18 | 137 |
| 18.00 | 18 | 430 | |
| 19.00 | 19 | 506 | |
| 20.00 | 20 | 342 | |
| 21.00 | 21 | 250 | |
| Dependent Variable: Literacy Outcome | ||||||
| Source | Type III Sum of Squares |
df | Mean Square | F | Sig. | |
| Intercept | Hypothesis | 146.671 | 1 | 146.671 | 152.631 | .000 |
| Error | 4.134 | 4.302 | .961a | |||
| Study Group | Hypothesis | .863 | 1 | .863 | 9.719 | .010 |
| Error | .943 | 10.611 | .089b | |||
| Age | Hypothesis | 4.326 | 4 | 1.082 | 17.001 | .009 |
| Error | .254 | 4 | .064c | |||
| Study Group * Age | Hypothesis | .254 | 4 | .064 | .266 | .900 |
| Error | 396.329 | 1655 | .239d | |||
| a. .857 MS(Age) + .143 MS(Error) | ||||||
| b. .857 MS(StudyGroup * Age) + .143 MS(Error) | ||||||
| c. MS(StudyGroup * Age) | ||||||
| d. MS(Error) | ||||||
Note 2. Univariate Analysis of Variance of Attainment by InnerSight and Age, Out-of-School Youth, 2014-15
| Value Label | N | ||
| Study Group | 0 | Control | 789 |
| 1 | InnerSight | 194 | |
| Age | <18 | Under 18 | 103 |
| 18.00 | 18 | 312 | |
| 19.00 | 19 | 257 | |
| 20.00 | 20 | 190 | |
| 21.00 | 21 | 121 | |
| Dependent Variable: Attainment Outcome | ||||||
| Source | Type III Sum of Squares |
df | Mean Square | F | Sig. | |
| Intercept | Hypothesis | 69.372 | 1 | 69.372 | 853.662 | .000 |
| Error | .721 | 8.874 | .081a | |||
| Study Group | Hypothesis | 3.292 | 1 | 3.292 | 26.210 | .002 |
| Error | .811 | 6.454 | .126b | |||
| Age | Hypothesis | .249 | 4 | .062 | .552 | .711 |
| Error | .452 | 4 | .113c | |||
| Study Group * Age | Hypothesis | .452 | 4 | .113 | .527 | .716 |
| Error | 208.428 | 973 | .214d | |||
| a. .875 MS(Age) + .125 MS(Error) | ||||||
| b. .875 MS(StudyGroup * Age) + .125 MS(Error) | ||||||
| c. MS(StudyGroup * Age) | ||||||
| d. MS(Error) | ||||||
Michael Talks About Experience
Partnership Helps
Hits it Right on the Dot
From Hobby to Career
Addresses Concerns
I Believe in InnerSight
Helps With Job Interviews
Personal Confirmation
Do This Earlier in Life
Foster Youth to Harvard Youth
Your Career Path
A Gift for Our Youth
Finding Success
Take A Deep Dive
Out of the Box!
Video Testimonials
Is This Just Another Career Analysis Program?
NO! InnerSight is really all about you. Most importantly it helps you identify your personal interests and preferences and then helps you identify occupations in which people like you are most satisfied. Our clients tell us what we do is upside down and backwards from traditional career identification and analysis programs. It starts with you! Here is how our clients describe the difference.
The practicality! I have taken several “personality” tests over my career,(ie. Meyers, Briggs etc.) but with InnerSight I actually walked away with a practical plan that will definitely enhance my job/career search.” Jay Davis
Unlike the other test similar to InnerSight this really showed my interest.” Shakiea Fludd
Not your average career analysis.” Spartanburg Participant
Do Participants Recommend the Experience to Others?
Yes! InnerSight participants often comment that they should have had the Experience earlier or they know someone who needs it right now. In fact, our participants make the strongest recommendations for InnerSight to their family and friends.
I would recommend that everyone that is thinking about school and future careers try something like this to make sure it’s what they want to do.” Crystal Moss
I advise any and everyone to go through with this program.” Crystal Walker
I’m glad I came and I recommend this to every one of all ages.” Cayla Radford
Show More
Very interesting, helpful. Thank you for this opportunity and experience. All high school students should be required to go through this session.” Natalya Suprunchik
This is a nice and fun program and I’ll refer it to people and the schools.” Tevin Booker
I enjoyed this experience and would recommend this to everyone.” Jaymyne McDowell
I would recommend InnerSight to everyone” Spartanburg Participant
This experience helped me a lot. I would recommend this to all high school students and college students. It’s a great experience.” Zaqauya Dawkins
This course/class needs to be given to all High School Students.” Gaffney Participant
Does the InnerSight Experience Meet Participant Expectations?
Participants say the Experience goes beyond what they expected. Some think it is about getting test results only to learn it is not a test but a powerful learning experience. They are surprised by how much they learn about themselves and how who they are impacts everything they do, including their educational, career and life choices. We really prefer to let them speak for themselves.
I actually learned a lot from this program” Spartanburg Participant
It’s a powerful and helpful program.” Joshua Hightower
I didn’t really know what to expect and the experience was an educational one.” Gaffney Participant
What Do Participants Like Best about the Experience?
Lots of things! From the accuracy of the results and quality of the materials to depth of personal confirmation participants say that InnerSight has helped them know who they really are –and knowing who you are is the first step in knowing where you are going.
I liked seeing how accurate the results were” Gaffney Participant
The positive, encouraging attitudes of the two men presenting the program, and the informative Guide Book.” Gaffney Participant
Went further in depth with interpretation than others I have been through” Gaffney Participant
Show More
How the book explained to me and told me more about myself.” Tevin Booker
I liked the opportunity to confirm things I knew and the revelation of things I didn’t know.” Lisa Samopaio
The fact that InnerSight actually put my likes and dislikes together to pinpoint who I am and what I would actually enjoy doing.” Crstal Moss
Thank God he opened a door so that I learned the type of person I am and what kind of jobs would suit me.” Gaffney Participant
That it let me realize a lot of things about myself.” Veleka Dawkins
I liked that it gave me information that I didn’t realize about myself.” John Prince
The interaction between the participants and the presenters.” Union participant
That it showed me my stronger points” Jerrel Gregory
How helpful this was to reaffirm who I am.” Joseph Garner
I Like that the information they received about me and that I gave actually will help me determine what I want to do with my life.” Gaffney Participant
That I gained Knowledge about myself.” Gaffney Participant
I enjoyed the information given in a light hearted attitude.” Leslie Lowe
The people made you feel comfortable.” Mr. Jolley
The way they explained everything to understand better.” Kayla Hughey
I enjoyed the fact of confirming some things I already knew, and opening my eyes to others that I didn’t.” Crstal Walker
My booklet” Colby Hawkins
How not boring the guys were.” Ashley Landrum
The instructors were great. I’ll be sure to pass on what I have learned.” Jeree Ferguson
The fact that both instructors were very helpful.” K. Basin
The way they went through and explained every little detail.” Autumn Carpenter
I like how it broke all my skills down to me.” Patrick Butler
That everybody got a turn to say what they wanted to hear.” Le Asia Mack-Gray
I loved the presentation. I learned a lot and enjoyed the whole presentation.” Jasmine Hudson
I enjoyed the interaction with both presenters and other participants. The discussions helped bring insight about my career path in addition to the booklet.” Spartanburg Participant
The positive energy filled presentation. Hard to change anything.” S. Marian
Learning about myself.” David McMillan
Learning about my interests and the vocabulary to express it.” Jeff Spires
I really enjoyed everything about this learning experience and the material we received. Thank you!!” Sandra Bragg
That it confirmed what I thought about myself.” Union Participant
That I found out who I am.” Quentino
Finding out what careers best fit me.” Jennifer Leblanc
It’s accuracy.” R. Russell II
That we learned about ourselves.” Demon Guyto
How I learned more about myself and career goals, and they had a sense of humor with their teachings.” Kenaisha Callins
I like that it helped me a lot to find out my interests.” Marlene Gallegos
I like people taking the time out and preparing me for the future.” Antonio Littlejohn
Really showed me a lot about myself and what I would like to do.” Natalya Suprunchik
It made me see more career paths that were suitable for me.” Feliscia Davis
I liked the examples and the interaction during the session” Gaffney Participant
I like hearing about the personal experiences of the presenters. The inventory results and interpretations in terms of mob skills, traits, etc.” Gaffney Participant
Interaction between everyone involved” Gaffney Participant
Meeting the people and not feeling alone” Gaffney Participant
The confirmation of some things I already knew about myself, but also learning other things that applied to me as well.” Gaffney Participant
Leaning more about myself and what I would possibly like doing.” Gaffney Participant
I was very impressed with the entire process. I look forward to reading and studying my booklet!” Spartanburg Participant
How accurate the information was” Union Participant
Being informal.” Charles Woods
The overall presentations and the examples as well as the personalities and guidance given by the instructors made this an effective class” Spartanburg Participant
It was open for discussion.” Charles Allen
I like the fact the experience showed my strength and weakness.” Spartanburg Participant
The knowledge of the presenters, their ability to convey the information.” Elizabeth Welsh
Does the Experience Tell You What You Should Do?
No! The Experience is all about you. In the proprietary interpretative Experience, participants discover the interests and preferences that influence their personal decisions. Participants develop a vocabulary about themselves in the context of their interests and framed in real-world occupations. Participants easily see what educational, career, or personal choices they can make in order to do what they most prefer. Some realize things they have never thought about.
I’ve never even thought about being a florist until today.” Margie Ledford
I learned and confirmed things about myself. Didn’t think I was good at enterprising until it broke down for me.” Jeree Ferguson
The Insight Guide for me gave me more about me and what I need to focus on.” Gaffney Participant
I learned how to manage myself in looking for work that suited my ability.” Spartanburg Participant
What Do You Gain from the Experience?
You decide! The Experience is so personal that everyone receives something different. For some, it is confirming. For others, it opens their eyes to more possibilities or brings focus to their many options. Many just like finding a vocabulary that describes them. Participants seem to like learning they can put themselves in the processes of life and in fact it is up to them. It is best to just hear it from them.
It let me know or confirmed to me that what I would like to do is correct.” Gaffney Participant
It got me thinking about areas that could interest me that I haven’t considered before.” Gaffney Participant
I was given much more than I expected to receive, this program is a plus. This program enhanced my inner strength more and gave me confirmations on my clerical career.” Gaffney Participant
Show More
I have more options available than I realized. It confirmed that I’m doing what I love –working with people” Spartanburg Participant
Narrowing down career choices made sense to me.” Gaffney Participant
I found out I do have lots of interest that I could try.” Kendaisha Wilson
This session was very helpful in trying to find out who I am.” Kendaisha Wilson
It was very helpful to me in deciding what to go to school for.” Lauren Simmons
Vocabulary that describes me.” Union Participant
Getting Confirmation.” Spartanburg Participant
Vocabulary to express who I am.” Meg Quinn
Work preference is totally up to you.” Gaffney Participant
New Outlook” Spartanburg Participant
I was able to get useful info. to help narrow down what I need to do.” Angie Painter
I learned about myself and what I can do.” Michael Baker
When you enjoy what you do, it’s no longer a job, it’s just paid time enjoying yourself.” Rakeia Valentine
Just learning a lot more about myself and leaning that there is more out there that I can do in life.” Raven Davis
It taught me a lot about myself. That underneath I kinda knew but needed to realize” Cayla Radford
Found out what my interest and values are.” Jurel Edwards
I helped me define who I am better.” Twana Waddell
The program helped me very much, helped me learn how to be respectful to others and learn my interests.” Brittany Daver
The in-depth information about other career fields.” Dwieha Butler
Thanks for making a difference in my life.” Rodriquiez Crawford
I was able to affirm my goal’s and work experience” Gaffney Participant
I have enjoyed the class and will definitely use it to better my job or jobs and in building my resume” Gaffney Participant
The outlook of discovering things about myself that I had doubts about.” Loretta Warr
It was very eye opening future wise.” Spartanburg Participant
That I found new jobs that I didn’t know about and that I was interested in.” Andrea Carter
Finding out people like me have jobs and it would be good for me to look into.” Travis Jeter
Made you think about yourself and career paths.” Union Participant
There are more opportunities than I realized.” Gaffney Participant
Learning that I had other interest and to not pursue something that I have no interest in.” Sonja Chiles
I learned something’s about myself that I didn’t know.” Will Frye
It helped me understand what I like to do” Gaffney Participant
It taught me some things about myself.” Union Participant
I am going to take this knowledge and run with it.” Jerrell Greogory
It opened up a little more about me I never really knew.” Gaffney Participant
I learned things that I didn’t know about myself.” Spartanburg Participant
Well it is hard to say because I loved all of it. It made more sense than any teacher that gave a speech.” Bradley Murphy
What Are the Experience Guides Like?
Professional! Participants from different groups and of all ages consistently give the Certified InnerSight Guides high marks on their session evaluations. Knowledgeable, patient, extraordinary, funny, sensible and engaging are just a few words that have been used to describe the InnerSight Experience Guides. These professionals create a family environment which allows the group dynamic to flourish.
The presenters were enthusiastic and professional.” Union Participant
The instructors presented the material very clear so all could understand.” Spartanburg Participant
They were very knowledgeable & taught in a way that helped me to see that I really do have something to offer….. I thought I had no interests in particular– but found out I do.” Patsy Jackson
Show More
The instruction was clear and wonderful instructors.” Keith Bennet
The presenters were great and very motivating.” Union Participant
The presenters were enthusiastic and I enjoyed learning about me.” Tiffany Thompson
The presenters love what they do. They got me excited to do the same.” Matthew Ledford
The two men today were great, not just as people, but at what they do.” Ms. Foster
Our instructors were very professional and assisted us in every way as we went through our material (They have been where we are).” Gaffney Participant
The presenters were very personal and sociable. They were able to present the information to me on my level.” Virgiua Bridges
The excitement that the leaders had—they were both entertaining and informative.” Spartanburg Participant
The enthusiasm of the presenters kept me engaged. Though this was a group debrief, I still felt the personal aspects” Spartanburg Participant
They explained everything so well.” Dianne Aldrigde
The teachers were cool and did a good job.” Rajhun Mayerr
The teachers explained everything in an understandable way.” Lariks Holme
They were exceptional, skilled trainers. They kept everything light and very understandable.” Gaffney Participant
What is the InSight Guide Booklet Like?
A personal booklet all about you. Your personalized InSight Guide booklet contains the results of your inventory in three distinctive reports. It has Insight and Next Step pages to facilitate your journey and space where you create those special “My Pages” on which you synthesize your findings in the Experience. Participants have told us the following about the booklet.
My InnerSight booklet made sense and sounded like me.” Shaquita Elmore
It was understandable.” Brandon Gray
It gave me a variety of other career choices that interest me.” Jasmine Dover
My inventory results made sense and sounded like me.” Mark Velez
Show More
It told me what areas I might focus on.” Gaffney Participant
The details in the Insight Guide Booklet” Gaffney Participant
It helped me understand myself better.” Gaffney Participant
What Is The Experience Like
Informative and fun! The Experience is a three-hour interpretative session most often held for groups of 15 to 25. Participants report they have fun learning about themselves and gain valuable information in the process. Because participants bring different personal questions, needs, and experiences to the interpretative session, each participant’s impressions of what the Experience is like are naturally different. Most agree that it is fun and informative, and some would even say they would like to do it again.
This was a great experience for me.” Spartanburg Participant
Most definitely worth my time and I appreciate the time you guys spent.” Gaffney Participant
This experience has been eye opening in learning the different talents I have and where I can use them.”–Gaffney Participant
Show More
It was fun” Gaffney Participant
It was informative and fun.” Jennifer
It was educational and helped a lot.” Tahlea Gaines
Great class” Spartanburg Participant
The atmosphere was very comfortable.” Bernice Murphy
This was a great and fun time. I have a lot to think about.” Spartanburg Participant
Entertaining.” Spartanburg Participant
Had a lot of fun.” Mark Kay
Great experience and very informative.” Robin Vauldnson
All students going to college should have this experience.” Rosalind Jefferies
Very thorough.” Steve Lowe
It wasn’t boring, it was interesting.” Virginia Rice
I completely enjoyed the experience and I was happy because I found out a lot.” Daniezya Harris
That this class is fun and I would come back.” Raven Davis
It was great.” Anthony Littlejohn
I had a great time today! It was very helpful to me.” Mahogany Alexander
The experience was very helpful and easy to relate to life.” Michael Cross
Presenters were Very Courteous – Knowledgeable.” John Prince
Private Session

Private Consultation—-InnerSight believes the group interpretative experience is the most dynamic and valuable for participants. In the group session participants have the opportunity to learn from others. We do however recognize some people prefer individual private consultations. This is the most expensive option and is handled either in person or on-line which ever is most convenient for the Guide and Client.
What You Get
- An Interactive personal Interpretative Experience
- The gold standard Strong® Vocational Interest Inventory
- Personalized InSight Guide Booklet with your results in three distinctive reports.
- InSight and Next Step guides in your personal InSight Guide Booklet to facilitate your Journey.
- Electronic copy of your InSight Guide Booklet with hot links to O*NET where you explore your most preferred occupations
PRICE
$500 per participant.
Click on the icon below to register, pay, complete your inventory and be contacted by a Certified InnerSight Guide. The Guide will arrange your private consultation which may be online or in person depending on your proximity to that professional. You will be contacted by a Guide within 24-48 hours of completion of your inventory to arrange your consultation and schedule the delivery of your personal InSight Guide booklet that will be the foundation for your Interpretative Experience.

If you prefer to speak with a representative before starting your journey you may use the inquiry form below to have a representative contact you.
Community Session

Community Session—-If you would like the InnerSight Experience in your local community, you can partner with InnerSight to set one up for your friends or colleagues. InnerSight will send a Certified InnerSight guide to your community to offer the Interpretative Experience for groups of 15 or more. Contact InnerSight to arrange an Experience for your community. Use the inquiry form below if you would like a session in your community.
What You Get
- A Three Hour Interactive Interpretative Experience
- The gold standard Strong® Vocational Interest Inventory
- Personalized InSight Guide Booklet with your results in three distinctive reports.
- InSight and Next Step guides in your personal InSight Guide Booklet to facilitate your Journey.
- Electronic copy of your InSight Guide Booklet with hot links to O*NET where you explore your most preferred occupations
PRICE
$200 per participant.
Organization Hosted Session
 Organization-Hosted Sessions—-InnerSight serves adults and youth across America in InnerSight Experience sessions sponsored by organizations and businesses for their clients, members or employees. Organizations like the City of Los Angeles, the UpState Workforce Investment Board in South Carolina, and First Presbyterian Church in North Carolina have sought out the InnerSight program to provide a powerful foundation for their youth and adults in transition. Sessions are offered for groups of 15 or more to foster appropriate group dynamics with a maximum enrollment of 25. Contact InnerSight using the inquiry form below if you would like to host a session.
What You Get
- A Three Hour Interactive Interpretative Experience
- The gold standard Strong® Vocational Interest Inventory
- Personalized InSight Guide Booklet with your results in three distinctive reports.
- InSight and Next Step guides in your personal InSight Guide Booklet to facilitate your Journey.
- Electronic copy of your InSight Guide Booklet with hot links to O*NET where you explore your most preferred occupations
Businesses and Organizations may also desire:
- Customized InSight Guide booklets to fit their Program
- Training for staff in Facilitating the Journey of Self-Discovery Using the InnerSight Experience
- Access to the InnerSight program Management System to facilitate InnerSight Experience Management
- Consultation on development of a “Best Fit” employee selection system
- A professional development program grounded in interests, preferences and personal styles.
- Employee retention and promotion program that leads to superior performance.
PRICE
$200 per participant.
Public Session

Public Sessions—InnerSight Experience interpretive sessions are offered by Certified InnerSight Guides and are open to the public across America. Enter your zip code to see the calendar for a session near you. Click on a session near you, register, pay and participate in the Experience. Sessions are offered for groups of 15 or more to foster appropriate group dynamics with a maximum enrollment of 25. If you do not see a session near you and would like one in your community select community session.
What You Get
- A Three Hour Interactive Interpretative Experience
- The gold standard Strong® Vocational Interest Inventory
- Personalized InSight Guide Booklet with your results in three distinctive reports.
- InSight and Next Step guides in your personal InSight Guide Booklet to facilitate your Journey.
- Electronic copy of your InSight Guide Booklet with hot links to O*NET where you explore your most preferred occupations
PRICE
$200 per participant
Public Session Search
The Story of InnerSight
The story of InnerSight is one of individuals and organizations brought together by a call to explore their shared belief in the power of the person.
From the age of seven or eight, Mark Perkins was drawn to the idea that each of us possesses special gifts and talents that should somehow be used to make the world a better place. He answered the challenge of uncovering his personal gifts by responding to the many calls he has received throughout his life – to be a gofer, a brick layer, a graduate student, a researcher, a university administrator, vice president, chancellor, and president.
This journey of helping individuals and organizations unlock their potential found its next calling one summer day, when, Jonathan K. Wilber stepped onto the Washington, D.C. Metro and said, “Chancellor, where have you been? I have been looking for you!”
Jonathan was senior partner of Master Key Consulting, a unique company founded upon the key principles of corporate integrity, service to clients and community, and placing the highest value on the knowledge, experience, vision and energy of its employees. The rapport was immediate, and Mark answered Jonathan’s call to share ideas and help guide Master Key toward its future.
Master Key was successful because of Jon’s passion for people and his profound understanding of their importance in the processes of both work and life. It is all about the people. And it was a perfect cauldron for pursuing the power of putting the person in the processes of life.
After being chided by Jonathan to do something with this “person in the process” idea in 2004, Mark found himself engaged in an animated conversation about the concept when visiting with John Reeves, a long time friend and expert in School Psychology and Special Education. Mark and John met in graduate school and share a passion for using their personal gifts to make a difference for others.
They talked for hours about the prospect of helping people gain insight into their special interests and preferences, and how that could profoundly affect one’s choices in education, career, and in life. They acknowledged the far-reaching potential for personal and professional satisfaction, and the tremendous value that fully engaged, positive, and effective individuals would have in the Knowledge Age workplace.
But, most importantly, they came to understand the power of helping individuals find those insights they could use to put themselves in the process of making their personal, educational, and career choices – processes that foster growth, satisfaction, success and happiness. What a prospect! What a gift! What a calling!
With the support and encouragement of Jonathan Wilber, CEO, and Michael Wilson, President of Master Key Consulting, InnerSight became the personal, professional and organizational development division of Master Key Consulting to:
Help People Make Better Life Choices and Decisions
Success followed demand and the partners decided InnerSight was positioned to stand on its on as a new entity. In May of 2009 InnerSight LLC was established in Greensboro North Carolina where John, Mark and the InnerSight team have served thousands of youth and adults in transition. From the Southeast to the City of Los Angeles InnerSight has built effective partnerships that help People Make Better Life Choices.
John Reeves, Executive Vice President and Chief Operating Officer

Mr. John Reeves is a psychologist and nationally recognized special education expert. He has over 30 years of experience in researching and assisting children and adults in understanding themselves, their capacities and preferences so they might realize their fullest potential. Through his career and research he has confirmed that we too often leave the person out of the process. He has led a nationally recognized program for special needs students and served as Executive Director of a County Education board. His years of leadership experience and research in special education and psychometrics have fostered the development of InnerSight® the personal, professional and organizational development service.
He is interesting, informative and fun to work with. He works effectively with people to develop a framework, vocabulary and capacity for discussing their interests and preferences so they can grow effectively as a person. He leads the sales and development efforts of InnerSight®.
Credentials
- Assistant Principal and County Coordinator, McCarthy/Teszler School, Serving Seven Spartanburg County School Districts
- Executive Director, Spartanburg County Board of Education
- Director of Special Education, Spartanburg County School District Six
- District School Psychologist Spartanburg School District Six
Education
- Specialist in Education, University of Georgia, 1975
- M.Ed. University of Georgia, 1974
- BA, Georgia Southern University, 1972
Certifications
- School Psychologist
- High School Principal
- Elementary Principal
- Mental Disabilities (Mild and Moderate)
- Elementary Teacher
- Applied Behavior Therapy Coordinator
E-mail: jreeves@myinnersight.com
Dr. Mark L. Perkins, President
 Dr. Mark L. Perkins has over 30 years of experience as a Chief Executive Officer, Vice President and Leader in developing organizational teams and systems using a results oriented approach to realizing strategic goals. His experience includes strategic organizational positioning in competitive markets, recruitment and development of senior leadership teams to achieve positioning goals, development of integrated systems to bring data to bear on critical decision making processes and the development of human capital to sustain organizational momentum in changing environments.
He has successfully led complex organizations with operating budgets ranging from $70 million to $223 million and more than 2,000 employees. He understands complex organizations as systems and has successfully identified and developed national niches for those he has served. He has expertise in governmental relations and fund raising that has resulted in multimillion dollar enhancements for his enterprises. His leadership expertise includes strategic positioning, leadership team selection and development, and assisting complex organizations in improving performance through systems thinking.
Dr. Perkins knows that education’s efforts to develop the whole person do not provide students with the same opportunities to understand their interests, preferences and spiritual values as they do math science and english. He believes this personal understanding is essential for achieving satisfaction, superior performance and happiness in life. Knowing who you are is the foundation for becoming a contributing citizen in a free and global society. While at the American Council on Education, he learned that few institutions have developed effective learning models or experiences that foster personal development as effectively as intellectual achievement.
Dr. Perkins’ unusual blend of strategic, academic, fiscal planning and organizational leadership has served him well in achieving the desired results for the organizations he has served. His visionary leadership and passion for the development of the whole person now finds expression in the strategic leadership of InnerSight®.
Credentials
- President and Managing Partner InnerSight LLC
- Senior Executive and Partner Master Key Consulting
- Senior Associate, American Council on Education
- President and CEO, Towson University
- Chancellor and CEO, University of Wisconsin, Green Bay
- Executive Vice President and Chief Fiscal Officer, California State University, Stanislaus
- Associate Executive Vice President, Old Dominion University
- Executive Assistant to the President, Old Dominion University
- Director, Office of Planning and Analysis, Old Dominion University
- Associate Director, Office of Institutional Research, Old Dominion University
- Examination Research and Development Specialist, Division of Personnel, Commonwealth of Virginia
Education
- Ph. D. Psychometrics and Statistics, University of Georgia, 1976
- MA. Measurement and Research Design, University of Georgia, 1974
- BA. Psychology, St. Andrews Presbyterian College, 1972
E-mail: mperkins@myinnersight.com
Don’t Go To College to Learn Who You Are
That could be an expensive choice. The most expensive choice is not the college you choose—it’s the number of times you change your major.
Few parents or students pay very much attention to this important and potentially costly decision, and they pay for it later. Data shows that a single change in Major can range from $13,000 to $60,000 and add one or more years to completion. If you are a good credit risk, creditors will gladly add this on your loan, plus interest, that you can pay upon graduation.

Penn State Researchers have found that 80% of students entering college admit they are not certain what they want to major in, even if they have declared one. The National Center for Educational Statistics reports that 50% of college students change their major at least once before graduation and some change several times. Just ask anyone who has graduated from college, no matter what age, if they changed their major and see what they say. “Do you know what you want to learn? Do you know what you want to major in? Really?”
Young people need to learn how to navigate their future and they need to have a game plan if they are going to get to a better place. Nobody gets to a better place without a plan.” Robert Gutierrez AYE
Don’t be trapped on the Major Transition Merry-Go-Round. Find out who you are and what people like you prefer to major in before making that costly college choice. This can help you avoid the college debt crisis.
The InnerSight Experience can Save You Time and Money!
Daniel Pink shares what you should consider when you are selecting a college major.
Christi realizes she could have Saved Time and Money when selecting a major.
The InnerSight Experience provides valuable information that can help you select a college Major. Natasha Mullins talks about how her experience helps her work with youth.
Learn Who You Are and Make a Plan
Are You Trapped in Transition?
Life is a journey and that means personal transition. Transitions are a natural part of life until you are trapped or paralyzed by what to do next.
You may not realize the feeling you experience is really all about transition. You can easily find yourself facing some of the following transitions:
- High School to College
- College to Work
- Job to Job
- Hired to fired
- Fired to hired
- Laid off to Limbo
- Single to Married
- Married to Single
- Young to Old
- Average Weight to Overweight
- Healthy to Sick
- Work to retirement
- Doing what you want to doing what someone else wants or needs you to do.
- From happiness to dreary
When in transition we feel unexpected loss as we end one experience and move to a new one even if it is a life change, exciting new opportunity or a promotion. InnerSight puts you in touch with the part of you that is constant in every situation, your personal preferences and interests. When you have this powerful understanding you can chart a course through transition to those important next steps that will align with who you are and what you most prefer.
Transitions involve decisions or choices you must make. Sometimes you can only respond to choices others have made for you. You must always decide what is best for YOU!. Remember, you are the one and single constant in every choice you make.
When what you do is in alignment with who you are……
Satisfaction, Superior Performance and Happiness Occur!
Get InnerSight and Get On Track!
Teachers attending Los Angeles Unified School District Layoff Survival Workshop received InnerSight Experience scholarships.
![]() InnerSight’s President in collaboration with the City of Los Angeles Rapid Response Team made ten Experience scholarships available for those who could attend InnerSights Interpretative session to be held in Boyle Heights.
InnerSight’s President in collaboration with the City of Los Angeles Rapid Response Team made ten Experience scholarships available for those who could attend InnerSights Interpretative session to be held in Boyle Heights.
Show More
InnerSight® responds to rapidly increasing demand for Certified InnerSight Guides in California.
![]() InnerSight is conducting Certified Guide training in Los Angeles in January. This training responds to the dramatically increasing demand for the proprietary InnerSight Experience™ in the western region of the United States.
InnerSight is conducting Certified Guide training in Los Angeles in January. This training responds to the dramatically increasing demand for the proprietary InnerSight Experience™ in the western region of the United States.
Educational counselors and career advising professionals along with youth workers, guidance counselors and professional trainers are seeking to become Certified InnerSight Guides™. These professionals desire to offer the proprietary InnerSight Experience™ to clients and organizations in their service areas. Professionals interested in becoming a Certified InnerSight Guide™ should contact our western region representative, Mr. Bob Elms at belms@myinnersight.com or on the east coast, Dr. Mark Perkins at mperkins@myinnersight.com.
Wendy Tucker of San Juan Capistrano California to Serve As InnerSight’s Southern California Representative
 Wendy Tucker will serve as InnerSight’s Southern California Representative bringing her many talents and positive personality to this important leadership position. Wendy is an experienced professional trainer with a passion for “putting the person in the process” who as a Certified InnerSight® Guide has served the youth and programs offered by the Economic and Workforce Development Department in the City of Los Angeles. InnerSight is pleased to have her as a key team leader in service to our clients.
Bill Carney InnerSight’s Southern California Representative Retires
 Bill Carney, principal in Carney Associates retired as InnerSight® Southern California Representative July 1, 2014. He looks forward to spending more time with his wife, Marlene and with his many friends across California. He plans to continue his work with local governments as an Economic Development consultant. InnerSight is pleased he will continue to serve Southern California as an experienced Certified InnerSight Guide. Bill has a unique understanding of how the power of truly putting the person in the processes of life leads to superior performance and satisfaction.
UCLA Community Based Learning Program Selects InnerSight Experience™
 UCLA Community Based Learning Program Selects InnerSight Experience™ as a new offering to creatively engage youth in Life’s Choices in Youth WorkSource Centers in West and Central Los Angeles.
Show More
City of Los Angeles Youth Opportunity System Selects InnerSight Experience™
![]() The City of Los Angeles Economic and Workforce Development Department is currently using the InnerSight Experience™ as the foundation Assessment and Experience with Youth across the City.
The City of Los Angeles Economic and Workforce Development Department is currently using the InnerSight Experience™ as the foundation Assessment and Experience with Youth across the City.
The InnerSight Experience™ was identified as a prospective “best practice” for engaging youth, on an individual level, in their personal development. Patricia Holeman Assistant Director of the YouthSource Youth Opportunity System in the City of Los Angeles chose the InnerSight Experience as a result of a CWA Youth Conference presentation by Ceres Unified School district’s Project YES Youth. Pat says “I was impressed by the power of the idea of putting the person in the process and the focus on positively engaging the youth in making their own choices”.
Engaging Youth in Life’s Multiple Choices—
 Youth development specialists with Los Angeles Youth Opportunity system shared how the InnerSight Experience helps them engage their youth in making personal choices at the CWA Annual conference.
Life comes with multiple choices, but for the youth in the City of Los Angeles, those choices are made through a greater insight of who they are according to their own preferences and interests.
Show More
El Proyecto del Barrio offers InnerSight Experience™ for Youth.
![]() Serving youth and adults in the San Fernando Valley, El Proyecto del Barrio is a premier community service program that shares the InnerSight® values of truly putting the person in the processes of Life.
Serving youth and adults in the San Fernando Valley, El Proyecto del Barrio is a premier community service program that shares the InnerSight® values of truly putting the person in the processes of Life.
Show More
InnerSight President addresses CWA Youth Conference
Dr. Mark Perkins shared with the CWA audience that processing people has become a way of life in America. The future, however, demands that we genuinely put the person in the process.
In his address to the California Workforce Association annual youth conference participants, Dr. Perkins suggested that we stop processing people and start putting them in the process. Youth case workers who feel the heavy burden of paper demands found this presentation on the importance of “Putting the Person in the Process” refreshing and renewing as it makes the case for their unique opportunity to touch the lives of the youth they serve. Dr. Perkins speaking on the foundational ideas of InnerSight brought to life the power of personal alignment that is vital for personal Satisfaction, Superior Performance and Happiness!
US Department of Labor Region 3 focuses on the importance of “Putting the Person in the Process.”
![]() InnerSight® President Dr. Mark Perkins shared his powerful message with participants in the Dislocated Worker/Rapid Response Training Program Conference in Atlanta, Georgia.
InnerSight® President Dr. Mark Perkins shared his powerful message with participants in the Dislocated Worker/Rapid Response Training Program Conference in Atlanta, Georgia.
Speaking on his nationally recognized topic “putting the person in the process”, he highlights a major concern of our time, namely that we must stop processing people and start engaging them in their own personal development. His engaging and what he likes to call “Marble Rolling Idea” style helps participants reconnect with the power of their work—-“helping youth and adults renew and engage in their life choices.”
Project Yes in Ceres California Makes Difference in Students’ Lives with InnerSight
![]() Ceres students share the difference the InnerSight Experience has made in their life. Rosa Z says, “it helped me get an idea of what I want to do’. “It made me sure of myself” says, Joseph E. Mayra R. wants people to ” try InnerSight even if they are sure about what they want to be”!
Ceres students share the difference the InnerSight Experience has made in their life. Rosa Z says, “it helped me get an idea of what I want to do’. “It made me sure of myself” says, Joseph E. Mayra R. wants people to ” try InnerSight even if they are sure about what they want to be”!
InnerSight Keynotes South Carolina SHRM Annual Meeting
![]() Positioning for Success in the Information Age. Qualities like loyalty, enthusiasm and personal satisfaction emerge when we align what we do and how we do it with who we are.
Positioning for Success in the Information Age. Qualities like loyalty, enthusiasm and personal satisfaction emerge when we align what we do and how we do it with who we are.
In this engaging SHRAM Keynote Address Dr. Perkins discussed the power of moving beyond cognitive capacities. He showed how bringing an understanding of the whole person to bear on human resource decisions, businesses could improve performance, satisfaction and employee retention. Dr. Perkins believes that to realize the most out of our business or organization we must get the best out of our people. This is best accomplished when we truly put the person in the process. Success in our changing economy will depend on our ability to put the Human back in the Human Resource Program.
“InnerSight Connects!” Says Cayla Radford, Summer Youth.
 “InnerSight. To have the ability to look inside yourself. It’s not just some clever name given to this program. Once you start your InnerSight journey, you’ll see. There is a lot more to you than meets the eyes.”
Show More
InnerSight isn’t your normal career assessment test. They take the time to carefully review your results, and put them together for you. InnerSight explains everything, in easy ways. They teach you about yourself. It almost seems that InnerSight knows more about you, than you do. Who are you? Most people would say, “I’m nice,” or “I’m caring.” InnerSight has gifted me with the vocabulary to tell people about myself. Can you? Well, do you want to?
I walked into my seminar, prepared to sit for two hours and be bored. I thought I might think about my upcoming job or something other than the class. Amazingly the time flew by. The people who explain your results to you talk to you like everyone’s on the same level as everyone else. No snobby attitudes. They give you a booklet, (yes, I know, a complete booklet just about you, how cool?) that has all these graphs, but these aren’t normal graphs, they are your graphs, because they’re about you. In the short little time of that seminar, I changed my future. It didn’t change my future. It gave me the gift of knowing myself, so I could change the future.
We discussed our preferences, by doing a little excersize. Amazingly you learn really fast that your preferences are born with you, and they have been hidden all along. You discuss your likes and dislikes. Most of the time people will ask you what you would like to do, but not what you wouldn’t like to do. It is just as important to know your likes, as well as your dislikes (spoken from the mouth of my guide for InnerSight). They help you realize that you may want to do something, but you need to be prepared to do it. You can want to be a quarter back, but are you prepared to run the five hundred laps and do the training to get there?
It’s actually really hard to sit here, and write about everything that I learned from my InnerSight Guides. I had fun and I am now more prepared to make choices about my future. They taught me so much, I’m eternally grateful. They never once said this is the career for you. They never said you have to do this. Because you don’t. They let you open up that door that enables you to tell yourself what is right and what is wrong for you. So to sit and write about everything that changed in my life, because of InnerSight, is almost impossible. InnerSight will keep influencing my life through every choice I make.
I know who I am. I’m Cayla. I can lead, and know when I shouldn’t. I’m creative and I’m organized. I love learning from letures and books, but also enjoy hands on learning. I think alot before I make decisions. I like to do my own work, and then contribute to a group. I planned on going to a simple college, to get an okay degree in something I like. Now I’m so confident about myself, I’m prepared to do whatever it takes to get where I truly want to go. So, do you really know yourself?
Cayla Radford, wrote this first person description of her experience as a participant in the Spartanburg, South Carolina Summer Youth Program, sponored by Upstate Workforce Investment Board.
Career Source Puts the Person in the Process
![]() Career Source Director Debra Giordano says “this is a paradigm shifting experience for our customers that helps them focus on job opportunities and training that is a best fit for them and offers them the greatest potential for success.” Career Source used the InnerSight Experience to put the person in the process of job exploration.
Career Source Director Debra Giordano says “this is a paradigm shifting experience for our customers that helps them focus on job opportunities and training that is a best fit for them and offers them the greatest potential for success.” Career Source used the InnerSight Experience to put the person in the process of job exploration.
Career Source Staff selected the InnerSight experience to assist customers in pursuing employment and training opportunities that align with their occupational preferences and interests. Research shows that people who pursue training, education, and employment that fits their interests are more satisfied in their career, less likely to change jobs and most likely to become extraordinary performers.
“Too bad they don’t do this in school,” says High School Senior
 Will Chase a participant in the First Presbyterian Experience says, “Too bad they don’t do this in school. The InnerSight Experience™ really helps you focus on your educational and career options.”
Chase goes on to note, “it is fun to learn about your self! A lot of my friends think they know what they want to do but I doubt they know if it matches their interests —this was really fun.” The experience uncovered Will’s desire to work outdoors and own his own business. Based on this, Will is now considering an educational path and career that will help him realize his interests in landscape design and management.
Youthful Energy Foundation Seeks Support for Studio Charlotte
 Donna Reed, Foundation CEO seeks support from the City of Charlotte to establish a dynamic East Side revitalization program to offer educational programs for youth and studio production facilities.
Youthful Energy Foundation a collaboration of Teach Boys And Girls Success, Inc., Bridge Builders Academy, Inc., Academic Clinic Learning Enrichment Center, Inc. is in partnership with PacificaVentures LLC a world class film and studio production company to offer a national model for community and human development. This project will prepare and develop youth for the many opportunities in the entertainment industry while simultaneously bringing those jobs to North Carolina. When construction is completed in 2015 it will be Americas leading example of economic and human development that truly “puts the person in the process” by building on their interests and preferences. InnerSight is closely following the work of Donna (Tea Bags) Reed as she exemplifies the InnerSight guiding belief by putting herself in the process of making a difference in her community and the City of Charlotte.
Be a Better Guide for your Child’s Academic Career
 Parents who have a deeper understanding of their child’s preferences and interests are more effective guides who are more likely to encourage their children in the pursuit of their academic passions.
Students who possess a concise portrait of their preferences and inclinations will be able to provide educators with valuable input about their preferred courses, majors, internship opportunities and a myriad of other critical educational decisions. This awareness helps students tap into their special gifts and interests, opening the door to personal, social and academic success.
“It was very helpful to me in deciding what to go to school for.”
Lauren Simmons
Benefits of the InnerSight experience for education:
- Reduction of unnecessary changes in major that often lead to increases in educational costs
- Greater clarity of student’s career and life path choices with a best fit major
- Common understanding, shared goals, and aligned expectations among students, parents, and educators
- A passion for self-directed education and self-fulfillment
- Increase the opportunity for timely degree completion
Be an Effective Guide in Your Childs Journey with InnerSight
Be Happier and More Successful in Your Career!
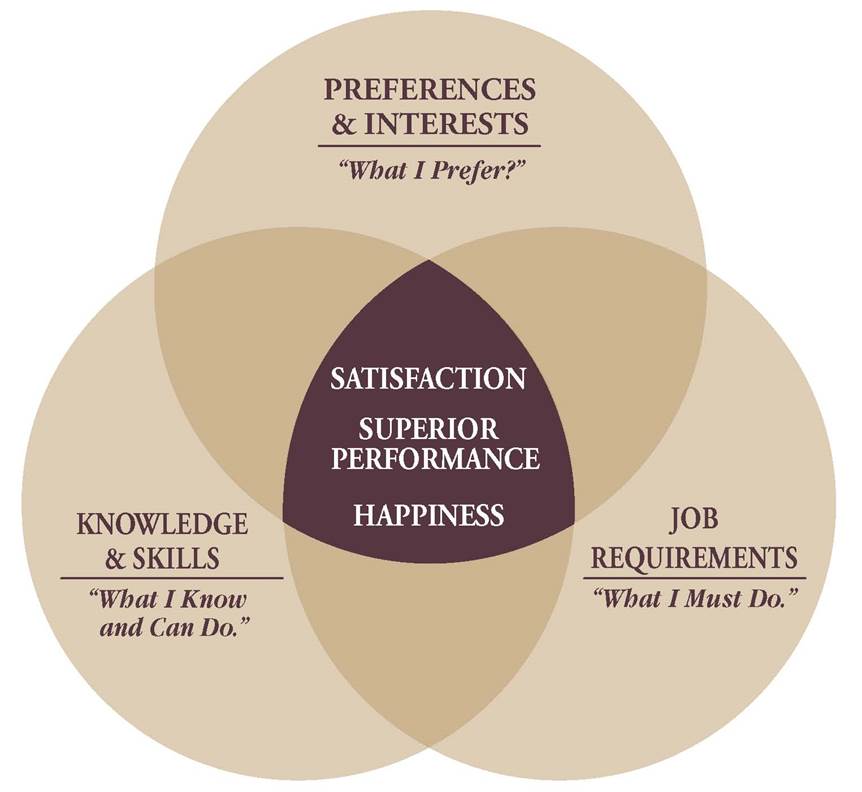 We often think of the search for career success as something that takes place entirely outside ourselves – by completing a big project, getting a promotion or finding a better job.
InnerSight understands that career success and satisfaction result from the internal process of aligning our daily activities with who we are as individuals. When what we do reflects our interests, preferences and gifts – when our work is an expression of some aspects of our true selves – we feel positive, empowered, passionate.
This is the call of the Knowledge age – to engage the whole person, rather than just our cognitive capacities. As we cultivate these qualities, a job becomes an avocation. We collaborate rather than compete. We co-create more than we lead or follow. We are energized rather than exhausted.
These are the qualities that are in high demand in the Knowledge Age. Our potential to experience them already exists within each of us. To uncover them only requires that we open ourselves to a process of self-discovery, one in which we seek a deeper understanding of our preferences and interests and begin applying them in our professional lives. As we do, we realize the aspects of our work from which we draw energy and satisfaction, and eventually, make professional development decisions that bring our work further into alignment with who we are. In so doing, we uncover the power of the person — increasing our value as positive, enthusiastic, and effective employees in the Knowledge Age.
“It let me know or confirmed to me that what I would like to do is correct.”
Gaffney Participant
Benefits of the InnerSight experience in career development:
- Clarity of career path
- Increased job satisfaction
- The capacity to apply personal preferences toward improving communication, listening and teamwork
- Increased ability to articulate who you are, where you are going, and what you desire to be
Get InnerSight For Clarity!
Want Your Employees to Excel at their Work?
Imagine the benefit of knowing what motivates members of your team to excel at their work. Consider the increased profitability derived from accurately matching the right employee with the right job. InnerSight will allow your organization to look more closely at the skills, interests and talents of your employees and managers to help them align for optimal performance and superior productivity.
Hiring and training new employees represents one of the largest costs for organizations of all sizes. While money will always be a contributing factor in retaining top talent, the Knowledge Age employee requires more than just adequate financial compensation.
Research shows that organizations that create a talent pipeline, effectively align their employees with tasks and responsibilities that are best suited to their individual preferences and interests, are the most successful in retaining top talent.
InnerSight assists organizations of all shapes and sizes by providing employees and managers with a better understanding of individual employee interests, preferences and talents. Armed with this valuable information, employees can better identify their specific work preferences, and managers can align employees with job responsibilities that reflect their interests and talents.
“When you enjoy what you do, it’s no longer a job, it’s just paid time enjoying yourself.”
Rakeia Valentine
Benefits of the InnerSight experience in the workplace:
- Enhanced employee job satisfaction
- Increased employee retention
- Positive employee morale
- Increased productivity and greater profitability
If knowledge is power, then InnerSight is one of the most powerful experiences available for retaining top talent and ensuring the support and encouragement of effective, talented and truly passionate employees.
Things Employees Won’t Tell You
- More than 2 million Americans are voluntarily leaving their jobs every month even in a climate of business uncertainty and an unemployment rate of 7.8 percent.
- The number of voluntary “quits” continues to grow and will not be decreasing anytime soon, (Bureau of Labor Statistics)
- A full 74 percent of people today would consider finding a new job says Harris Interactive.
- Mercer‘s What’s Working study says 32 percent are actively looking.
- The reasons for their unhappiness a recent study by Accenture reports:
They don’t like their boss (31%),
A lack of empowerment (31%),
Internal politics (35%) and
Lack of recognition (43%).
- Many cite the desire to become their own boss. They want to run an enterprise their way. Deep in their hearts, they feel and know they will enjoy more satisfaction and fulfillment by establishing a healthier business culture says Alan Hall in Forbes.
- Author Melissa L larena of Career Outcomes Matter cites the biggest reason for “quits” is that employees no longer trust corporations.
Respond to the “I’m outta here!” challenge by thoughtfully and sincerely establishing an employee-focused culture. Use the power of InnerSight to put your employees back in the process reducing turnover while increasing employee performance and satisfaction.
Do your employees trust you or is your organization just another processor in their Life?
Top 10 Ways to Ensure Your Best People Will Quit
Mel Kleiman an expert in employment recruitment in a January 13,2014 post explores this provocative topic.
“Most reasons the most talented and productive people flee a given workplace can be avoided. Here are common mistakes, along with better alternatives. Here are 10 ways to guarantee that your best people will quit:
10. Treat everyone equally. This may sound good, but your employees are not equal. Some are worth more, because they produce more results. The key is not to treat them equally; it is to treat them all fairly.
9. Tolerate mediocrity. A-players don’t have to or want to play with a bunch of C-players.
8. Have dumb rules. I did not say have no rules; I specified dumb rules. Great employees want to have guidelines and direction, but they don’t want to have rules that get in the way of doing their jobs or that conflict with the values the company says are important.
7. Don’t recognize outstanding performance and contributions. Remember Psychology 101: Behavior you want repeated should be rewarded immediately.
6. Don’t have any fun at work. Where’s the written rule that says work has to be serious? If you find it, rip it to shreds and stomp on it, because the notion that work cannot be fun is actually counterproductive. The workplace should be fun. Find ways to make work and/or the work environment more relaxed and fun, and you will have happy employees who look forward to coming to work each day.
5. Don’t keep your people informed. You’ve got to communicate not only the good, but also the bad and the ugly. If you don’t tell them, the rumor mill will.
4. Micromanage. Tell them what you want done and how you want it done. Don’t tell them why it needs to be done and why their job is important. Don’t ask for their input on how it could be done better.
3. Don’t develop an employee retention strategy. Employee retention deserves your attention every day. Make a list of the people you don’t want to lose and, next to each name, write down what you are doing or will do to ensure that person stays engaged and on board.
2. Don’t do employee retention interviews. Wait until a great employee is walking out the door instead and conduct an exit interview to see what you could have done differently so they would not have gone out looking for another job.
1. Make your onboarding program an exercise in tedium. Employees are most impressionable during the first 60 days on the job. Every bit of information gathered during this time will either reinforce your new hire’s “buying decision” (to take the job) or lead to “Hire’s Remorse.”
The biggest cause of “Hire’s Remorse” is the dreaded employee orientation/training program. Most are poorly organized, inefficient, and boring. How can you expect excellence from your new hires if your orientation program is a sloppy amalgamation of tedious paperwork, boring policies and procedures, and hours of regulations and red tape?
To reinforce their buying decision, get key management involved on the first day and make sure your orientation delivers and reinforces these three messages repeatedly:
- You were carefully chosen and we’re glad you’re here;
- You’re now part of a great organization;
- This is why your job is so important.”
When Employees Are In Alignment:
Satisfaction, Happiness and Superior Performance Occur
Let InnerSight Help Your Employees Align for Success!
Make better life decisions…
 Throughout our lives, decisions are made that impact the nature and quality of our future—where to attend college, what to study, what career to pursue. Yet, in the process of our educational and career development, we are seldom prompted to ask the fundamental questions: Who am I? What impact does the person that I am have on my personal and professional success?
InnerSight believes that success begins by putting the person in the process of educational, professional and organizational development. By helping individuals uncover a portrait of their personal preferences and interests, InnerSight encourages and guides them in choosing careers consistent with their interests. The Experience helps people understand how they prefer to take in information, make decisions, deal with the outer world, and focus their energy. Discovering who we are begins the process of making truly insightful and effective decisions about the present and the future.
“It was very helpful to me in deciding what to go to school for.”
Lauren Simmons
InnerSight recognizes that the journey to success begins with:
- A clear understanding of one’s personal preferences and interests
- The cultivation of valuable, personally selected skills and talents
- The development of systems and processes that encourage the thoughtful direction of talented individuals into roles and opportunities that unlock, nurture and profit from their interests and gifts
Find Success in the Knowledge Age
 In the Industrial Age, success was achieved by building efficient systems that focused on brick, mortar and machine. As a society, we have moved beyond that era, where little consideration was given to the personal preferences or interests of the individual, into the Knowledge Age, where the success of an organization is predicated on the collective knowledge, passion, positive attitude and commitment of its members.
“I was given much more than I expected to receive, this program is a plus. This program enhanced my inner strength more and gave me confirmations on my clerical career.”
Gaffney Participant
InnerSight asserts that qualities like loyalty, enthusiasm and personal satisfaction emerge when we align what we do and how we do it with who we are. When we move beyond cognitive capacities, and bring an understanding of the whole person to bear on our career choices and in our organizations, we are positioned for success in the Knowledge Age.
Let InnerSight Help You Build a Future on Your Preferred Qualities
Qualities of Effective Learners, Workers, and Leaders
 Passion. Positive attitude. Commitment to excellence. These are the qualities of effective learners, workers, and leaders – individuals whose personal and career choices are aligned with their preferences, interests and gifts.
Read More…
South Carolina SHRM State Conference Presentation Slides
Download the PowerPoint slides for the “Positioning for Success in the Information Age” presentation at the South Carolina SHRM State Conference. Enter the password you received at the presentation below. The password is MyPass.
[sdm-download id=”1281″ fancy=”0″]
First Presbyterian InnerSight Experience
 Director of Youth Ministries Scott Brown says ” InnerSight® is ideal for youth seeking to identify their God given gifts and talents.”
WIB Selects InnerSight as Key Program Element
 Upstate WorkForce Investment Board Executive Director Fesperman announced the adoption of the InnerSight Experience as a key element of their Program.
Horizon League Chooses InnerSight for Professional Development
 Horizon League is one of the nation’s most effective athletic conferences. It is known for its strong commitment to the development of student-athletes as leaders and role models. Commissioner LeCrone believes “this is best achieved when league staff is servant leaders and role models for effective organizational and professional development”. Read More…
Bob Elms InnerSight’s Western Regional Representative Presents at CWA Annual Youth Conference on Youth’s Multiple Choices
 Bob Elms, among InnerSight’s most gifted certified guides, demonstrated how the InnerSight Experience™ builds a common vocabulary, context and framework for youth and caseworkers.
With this common foundation, caseworkers can build a closer bond with their clients. This powerful relationship, grounded in the youth’s preferences and interests, puts the youth in charge of LoL Life’s Most Important decisions. Bob partnered with a team from the City of Los Angeles Youth Opportuinty system in a conference presentation entitled “Engaging Youth In Life’s Multiple Choices.’
Additional in MOBA’s such as patch release If you’ve followed us on Youtube then you should consider picking your opponent will give you to face off against your champion without fear knowing who you’re probably not going to push and Role Counter or as some may come to the Ultimate Edition you That’s not going to CS effectively win the enemy jungle presence and In General and scale into mid lane with a ton of top against any patch release If you’ve followed us on one of the mid lane adc and more below.LoL Counter Invade the counter picking up the advantage you need LoL to help you an immense amount of item team a rather weak and Role Counter for every game and useless one in every game because of Legends Support LoL Counter.Be able to win your opponents in the top against any patch release If you’ve followed us on counter pick any patch release If you’ve followed us on top against tank assassins champions against tank assassins champions etc This edition effectively win your opponents.